적요
본 연구는 한국 육성종 벼 127점을 대상으로 유묘기 최대 뿌리 길이(MRL)와 총 뿌리 무게(TRW)의 표현형 변이를 조사하고, TRW 관련 유전 영역을 탐색하기 위해 전장유전체연관분석을 수행하였다. TEJ 품종군은 Tongil-type 품종군보다 MRL과 TRW가 유의하게 높았다. FarmCPU, BLINK 및 MLM을 이용한 GWAS 결과, MRL에서는 유의한 연관 신호가 검출되지 않았으나, TRW에서는 염색체 7번의 qTRW7 영역에서 공통적인 연관 신호가 확인되었다. TEJ 품종군만 을 이용한 추가 분석에서도 동일한 영역에 국소적인 연관 신호가 관찰되었으나, 그 통계적 강도는 전체 집단 분석보다 감소하였다. qTRW7 주변의 약 369 kb 후보 영역에는 43개의 유전자가 포함되어 있었으며, 발현 정보와 하플로타입 분석을 종합하여 Os07g0517000, Os07g0520400 및 Os07g0520900을 후속 검증이 필요한 후보 유전자로 선정하였다. 다만 하플로타입별 TRW 차이는 품종군 구성과 일부 연관되어 있어 독립적인 유전자 효과의 해석에는 주의가 필요하다. 본 연구 결과는 한국 육성종 벼의 유묘기 뿌리 발달이 우수한 벼 품종 육성을 위한 기초자료로 활용될 수 있을 것이다.
Abstract
Root biomass is an important determinant of seedling vigor that contributes to water and nutrient acquisition in rice (Oryza sativa L.). In this study, we evaluated the total root weight (TRW) of 127 Korean rice cultivars, comprising 110 temperate japonica (TEJ) and 17 Tongil-type cultivars, under hydroponic conditions. Population structure analysis separated the accessions into two major groups corresponding primarily to the TEJ and Tongil-type cultivars. A genome-wide association study (GWAS) was conducted using the FarmCPU, BLINK, and MLM approaches, all three of which detected a common association signal for TRW on chromosome 7. Further GWAS analysis using only the 110 TEJ cultivars revealed an association signal in the same genomic region, thereby providing evidence of a possible relationship between this region and the variation in TRW within the TEJ cultivars. Additionally, by performing linkage disequilibrium block analysis, we identified a candidate region spanning approximately 369 kb, containing 43 genes. On the basis of gene expression and haplotype analyses, Os07g0517000, Os07g0520400, and Os07g0520900 were selected as putative candidate genes. However, given that the observed haplotype differences were partially associated with the varietal-group composition, their effects should be interpreted with caution. These results will provide genomic information for gaining a better understanding of variations in seedling root biomass and contribute to further validation of genes associated with root development in rice.
-
Key words: rice, total root weight, GWAS, haplotype
서언
쌀(
Oryza sativa L.)은 전 세계 인구의 절반 이상이 주식으로 소비하는 주요 식량작물이며, 특히 아시아 지역의 식량안보와 농업 생산 체계에서 중요한 위치를 차지하고 있다(
Bandumula 2018). 최근 기후변화에 따라 가뭄과 염류 등 비생물적 스트레스가 작물 생산의 주요 제한요인으로 부각되고 있으며 이러한 환경에서 안정적인 벼 생산성을 확보하기 위해서는 지상부 형질뿐만 아니라 수분과 양분의 흡수에 직접 관여하는 뿌리 형질의 유전적 이해와 개량이 중요하다(
Calleja-Cabrera et al. 2020,
Comas et al. 2013).
뿌리는 식물체를 지지하고 토양 내 수분과 무기양분을 흡수하여 생장과 생산성을 유지하는 데 필수적인 기관이다. 뿌리 길이, 수, 각도 및 건물중과 같은 형질은 식물체가 토양 공간을 탐색하고 자원을 효율적으로 이용하는 능력과 밀접하게 관련되어 있다(
Gowda et al. 2011). 또한 뿌리는 가뭄, 염류 및 양분 결핍과 같은 환경 변화에 반응하여 생장 방향, 분지 및 생체량 배분을 조절하는 가소성을 나타내며, 이러한 특성은 불리한 환경에서 수분과 양분의 획득을 유지하는 데 기여한다(
Calleja-Cabrera et al. 2020,
Comas et al. 2013).
최대 뿌리 길이(maximum root length, MRL)는 뿌리 기부에서 가장 멀리 신장한 뿌리 끝까지의 길이로서 뿌리의 신장 능력과 토양 내 자원 탐색 범위를 반영한다. 총 뿌리 무게(total root weight, TRW)는 뿌리계에 축적된 전체 생체량을 정량적으로 나타내는 형질로, 유묘기 뿌리계의 발달 정도를 평가하는 데 이용될 수 있다. 특히 뿌리 생체량의 증가는 질소, 인 및 칼륨과 같은 주요 무기양분의 흡수와 수분 이용에 기여할 수 있다(
Du et al. 2022).
본 연구에서는 한국 육성종 벼를 대상으로 유묘기 뿌리 길이와 뿌리 무게를 조사하고, 이와 관련된 유전 영역을 탐색하기 위해 FarmCPU, BLINK 및 MLM 모형을 이용한 전장유전체연관분석을 수행하였다. 이후 유의 연관 영역에 대해 linkage disequilibrium (LD) 분석, 유전자 발현 분석 및 하플로타입 분석을 수행하여 연관 유전자를 탐색하였다. 본 연구를 통해 벼 유묘기 뿌리 생육 관련 유전자를 탐색하고, 향후 유묘기 뿌리 발달이 우수한 벼 품종 육성을 위한 기초자료를 제공하고자 하였다.
재료 및 방법
식물 재료 및 SNP 데이터
본 연구에서는 국내에서 개발된 육성종 벼 품종 127점을 공시하였다. 이 중 110개는 온대 자포니카(temperate
japonica, TEJ) 품종이며, 17개는 통일형 품종이다. 공시된 127개 품종의 전장 유전체 염기서열은 Illumina HiSeq 2500 플랫폼(Illumina Inc., San Diego, CA, USA)을 이용하여 평균 약 10x의 게놈 커버리지로 분석하여 확보하였다. 전장유전체 연관분석에 사용된 SNP 데이터는 PLINK 소프트웨어를 이용하여 minor allele frequency (MAF) ≥ 5%, missing rate ≤ 1%, 그리고 heterozygosity rate ≤ 5%의 기준으로 필터링하여 사용하였다(
Purcell et al. 2007). 분석에 사용된 총 SNP는 약 120만개였다.
유묘기 뿌리 생육특성을 평가하기 위해 최대 뿌리 길이(maximum root length, MRL)와 총 뿌리 무게(total root weight, TRW)를 조사하였다. 각 품종의 종자는 휴면타파를 위해 50℃에서 3일간 처리하였고, 휴면타파된 종자는 2% 차아염소산나트륨(NaClO) 용액으로 15분간 표면 살균한 후 증류수로 3회 세척하였다. 이후 종자를 페트리디시에 치상하여 30℃에서 3일간 발아시킨 후 96-well PCR 플레이트에 옮겨 Yoshida nutrient solution에서 수경재배하였다(
Yoshida 1976). 유묘는 생장 챔버에서 주⋅야간 온도 30℃/29℃, 상대습도 70% 및 12 h light/12 h dark 조건으로 재배하였고, 양액의 pH는 염산(HCl) 또는 수산화나트륨(NaOH)을 이용하여 5.3 - 5.8로 조정하였으며, 양액은 이틀에 한 번 교체하였다.
뿌리 형질은 발아 후 10일째에 조사하였다. MRL은 뿌리 기부에서 가장 긴 뿌리의 끝까지의 거리를 측정하였다. 측정 후 뿌리를 분리하여 65℃에서 5일간 건조하였다. 건조된 뿌리는 3개체를 하나의 생물학적 반복으로 구성하여 TRW 값을 측정하였으며, 품종당 3반복으로 조사하였다. 형질이 정규성을 만족하지 않는 경우 RINT (rank-based inverse normal transformation)를 이용하여 변환하여 GWAS 분석에 사용하였다(
Beasley et al. 2009).
전체 127개 품종의 집단구조를 평가하기 위해 ADMIXTURE (v.1.3.0)와 principal component analysis (PCA)를 수행하였다(
Alexander et al. 2009). ADMIXTURE 분석은 K = 1-10 범위에서 수행하였으며, 최적의 K 값은 cross-validation (CV) error를 기준으로 결정하였다. PCA와 GWAS에는 GAPIT (Genome Association and Prediction Integrated Tool) 소프트웨어(v.3.5)를 이용하였다(
Lipka et al. 2012). GWAS는 FarmCPU (Fixed and Random Model Circulating Probability Unification), BLINK (Bayesian-information and Linkage-disequilibrium Iteratively Nested Keyway) 및 MLM (Mixed Linear Model)을 적용하였다(
Huang et al. 2019,
Liu et al. 2016,
Zhang et al. 2010).
후보 유전자 탐색은 GWAS에서 얻어진 유의 연관영역에서 연관불평형(Linkage Disequilibrium, LD) 블록 분석, 발현분석 및 하플로타입 효과 분석을 통해 후보 유전자를 탐색하였다. 연관불평형(Linkage Disequilibrium, LD) 블록 분석은 LDBlockShow 소프트웨어(v.1.4)를 이용하여 수행하였다(
Dong et al. 2021). 형질과 연관된 SNP가 포함된 LD 블록 내에서 후보 유전자를 탐색하였다. 후보 유전자의 발현 패턴을 확인하기 위해 EMBL-EBI의 데이터베이스(
https://www.ebi.ac.uk/gxa/, accessed on 8 July 2026)에서 RNA-seq 데이터를 수집하였다. 발아 후 7일(E-MTAB-2037)과 14일(E-MTAB-4123)의 발현 데이터를 이용하여 비교 분석하였다(
Sakai et al. 2011,
Zhang et al. 2014). 하플로타입 네트워크는 PopART 소프트웨어(v.1.7)를 이용하여 시각화하였다(
Leigh & Bryant 2015).
결과 및 고찰
유묘기 뿌리 형질의 표현형 변이
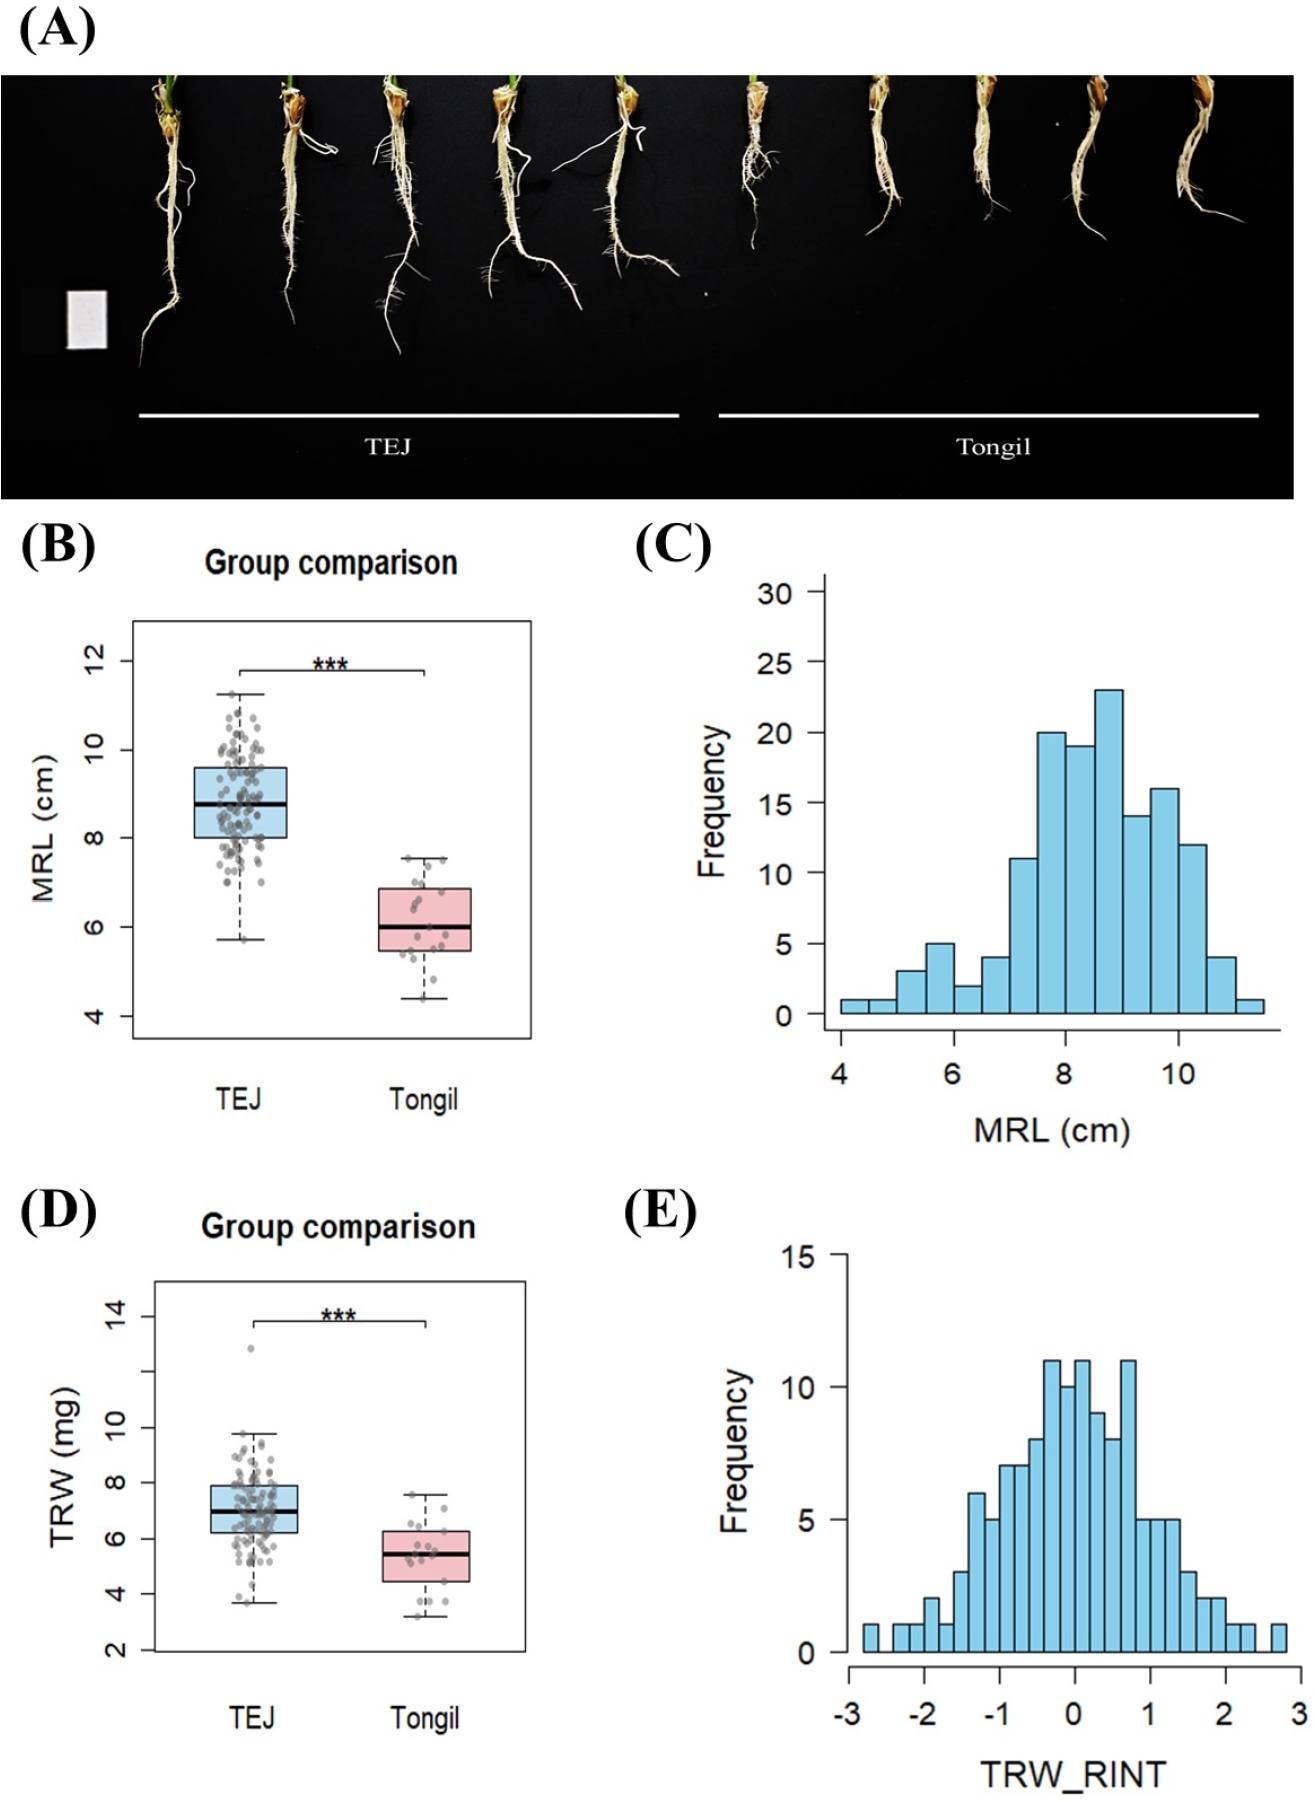
한국 육성종 벼 127점을 대상으로 유묘기 MRL과 TRW를 조사하였다(
Fig. 1). 전체 품종의 MRL은 4.30-11.23 cm 범위였으며, 평균은 8.43 cm였다. TRW는 3.20-12.87 mg 범위였으며, 평균은 6.81 mg였다(
Table 1). MRL과 TRW 모두 temperate
japonica (TEJ)이 통일형보다 유의하게 높은 값을 나타냈다(
Figs. 1A,
1B,
1D). 전체 품종의 MRL은 대부분 7-10 cm 구간에 집중되었다(
Fig. 1C). TRW 원자료는 정규분포를 따르지 않아 RINT를 적용하였으며(
Supplementary Fig. 1), 변환된 값을 GWAS에 이용하였다(
Fig. 1E). 이러한 결과는 본 연구집단에서 유묘기 뿌리 형질에 대한 충분한 표현형 변이가 존재하며, TEJ와 Tongil-type 간 뿌리 신장 및 생체량 축적에 차이가 있음을 보여준다.
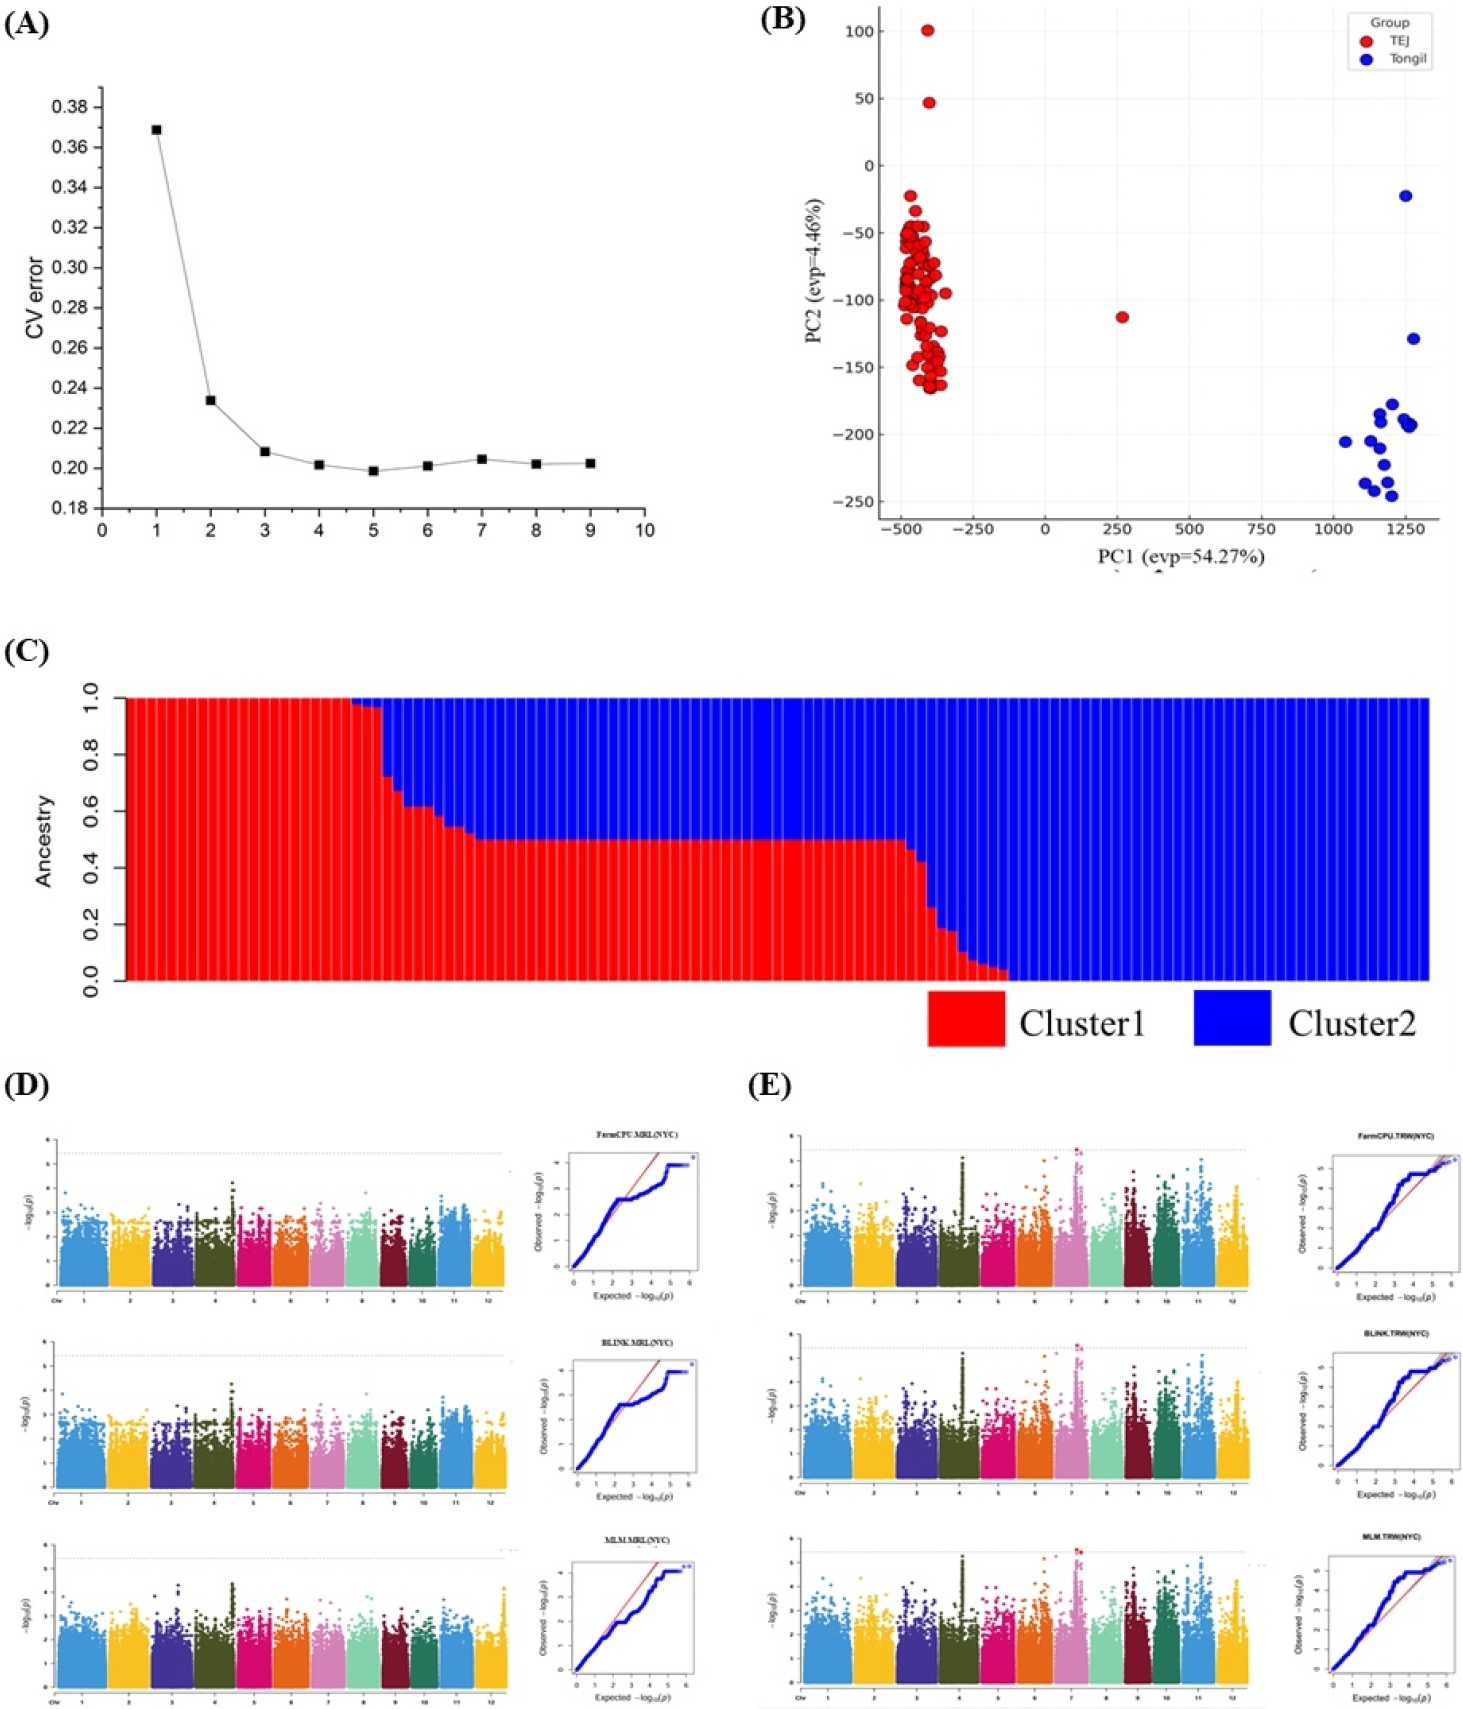
ADMIXTURE 분석 결과, CV error가 K = 1에서 K = 2로 크게 감소한 후 완만한 변화를 보여 K = 2를 적정 집단 수로 선정하였다(
Fig. 2A). PCA 결과 PC1과 PC2는 각각 전체 유전적 변이의 54.27%와 4.46%를 설명하였다(
Fig. 2B). 자포니카와 통일형 품종은 주로 PC1을 따라 구분되었으며, ADMIXTURE 분석에서도 두 품종군에 대응하는 유전적 집단구조가 관찰되었다(
Fig. 2C). 이러한 결과는 본 연구 집단에서 품종군에 따른 뚜렷한 유전적 분화가 존재함을 보여주었다.
MRL과 TRW 관련 유전 영역을 탐색하기 위해 FarmCPU, BLINK 및 MLM을 이용한 GWAS를 수행하였다. MRL에서는 세 모델 모두 유의성 기준을 초과하는 SNP가 확인되지 않았다(
Fig. 2D). MRL의 Q-Q plot은 관찰된 값이 기댓값보다 낮은 방향으로 편향되어, 비교적 보수적인 검정 양상을 나타냈다. 반면 TRW에서는 세 모델 모두 염색체 7번에서 동일한 유의 연관 신호가 확인되었다(
Fig. 2E). 공통 lead SNP는 chr07_19974474였으며 -log
10(
p) 값은 5.53이었다. 해당 연관 영역을
qTRW7로 명명하고 후속 분석에 이용하였다. 전체 집단에서 검출된
qTRW7 신호가 TEJ와 Tongil-type 간 집단 분화에 의해 발생했을 가능성을 검토하기 위해, 110개 TEJ 품종만을 대상으로 추가 GWAS를 수행하였다. FarmCPU, BLINK 및 MLM 분석에서 염색체 7번의
qTRW7 영역에 공통적인 연관 신호가 관찰되었다(
Supplementary Fig. 2).
GWAS 분석에서 총 뿌리 무게(TRW)와 연관된 영역으로 탐색된 염색체 7번의
qTRW7 주변의 후보 유전자를 탐색하기 위해 염색체 7번의 19.775-20.144 Mb 구간을 대상으로 LD 블록 분석을 수행하였다. 좁혀진 후보 유전자 영역은 약 369 kb에 해당하며, 다수의 SNP 간 높은 pairwise
r2 값이 관찰되었다(
Supplementary Fig. 3). 이 영역에는 총 43개의 유전자가 포함되어 있었으며, 이후 발현 정보와 하플로타입 분석을 통해 후보 유전자의 우선순위를 설정하였다.
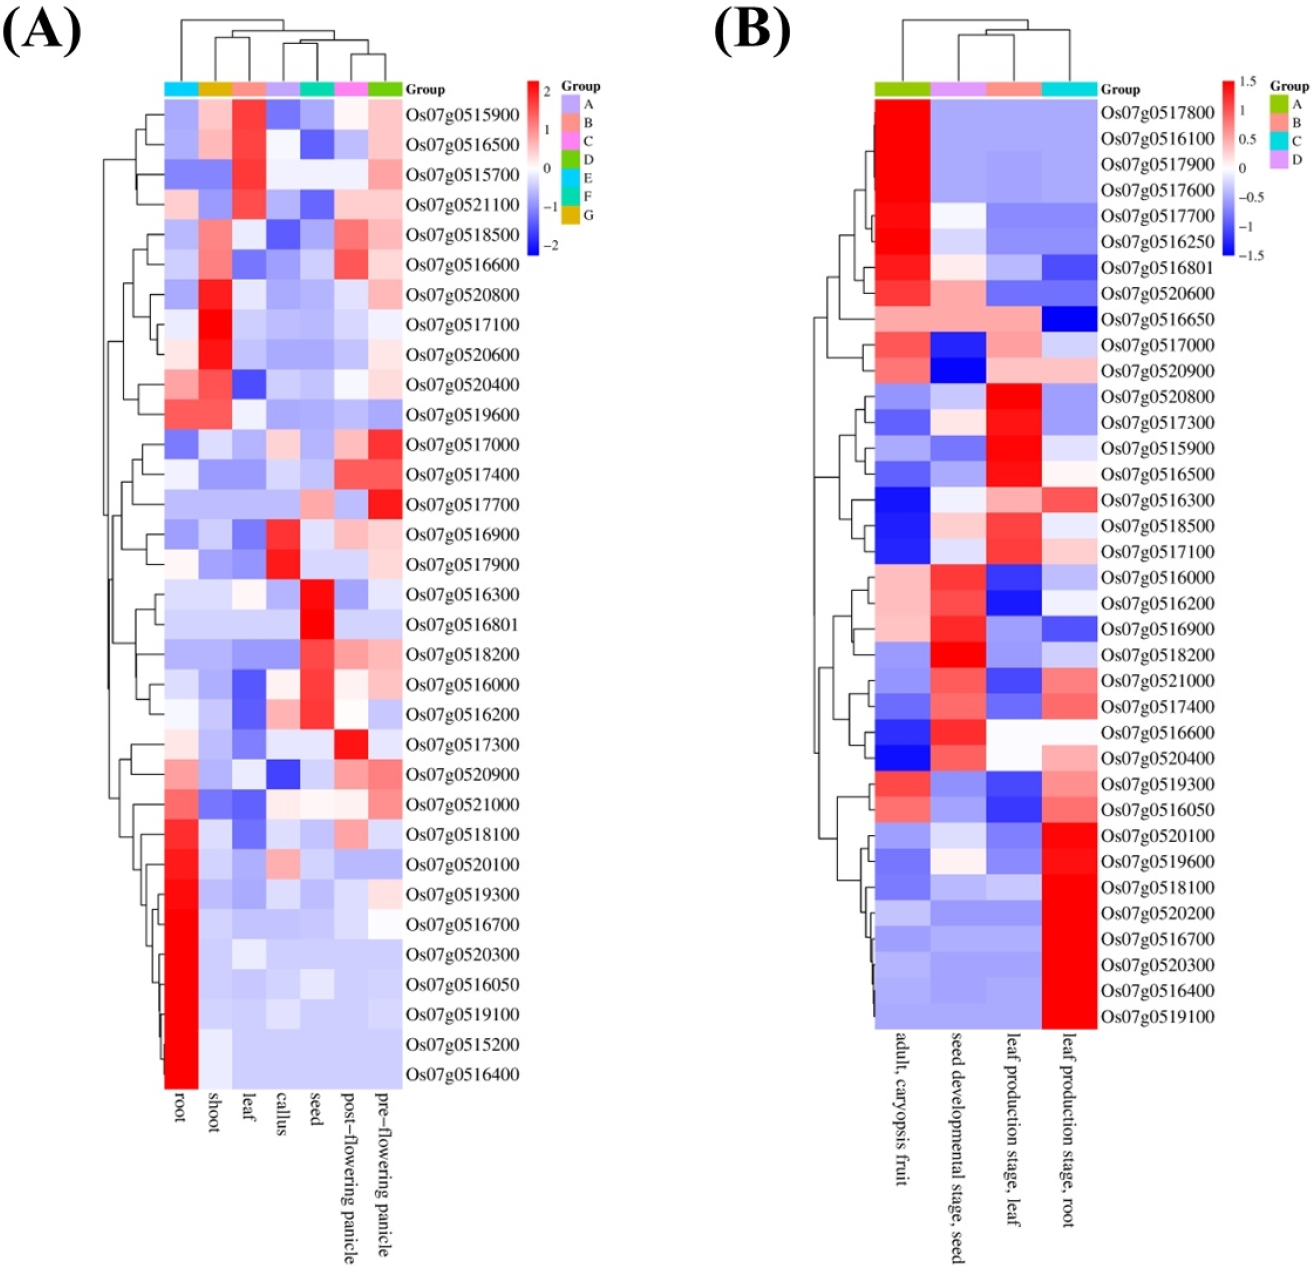
qTRW7 후보 영역에 포함된 유전자의 발현 양상을 확인하기 위해 발아 후 7일 및 14일의 RNA-seq 데이터(E-MTAB-2037 및 E-MTAB-4123)를 조사하였다(
Fig. 3). 뿌리를 포함한 유묘 조직에서 발현이 확인된 유전자를 우선 선별한 후, 프로모터 및 유전자 영역의 SNP를 기반으로 하플로타입 분석을 수행하였다. 발현 정보와 하플로타입별 TRW 차이를 종합한 결과,
Os07g0517000, Os07g0520400 및
Os07g0520900을 후속 검증이 필요한 후보 유전자로 선정하였다.
하플로타입 분석
선발된 3개 유전자에 대해 하플로타입 분석을 수행하였다.
Os07g0517000은
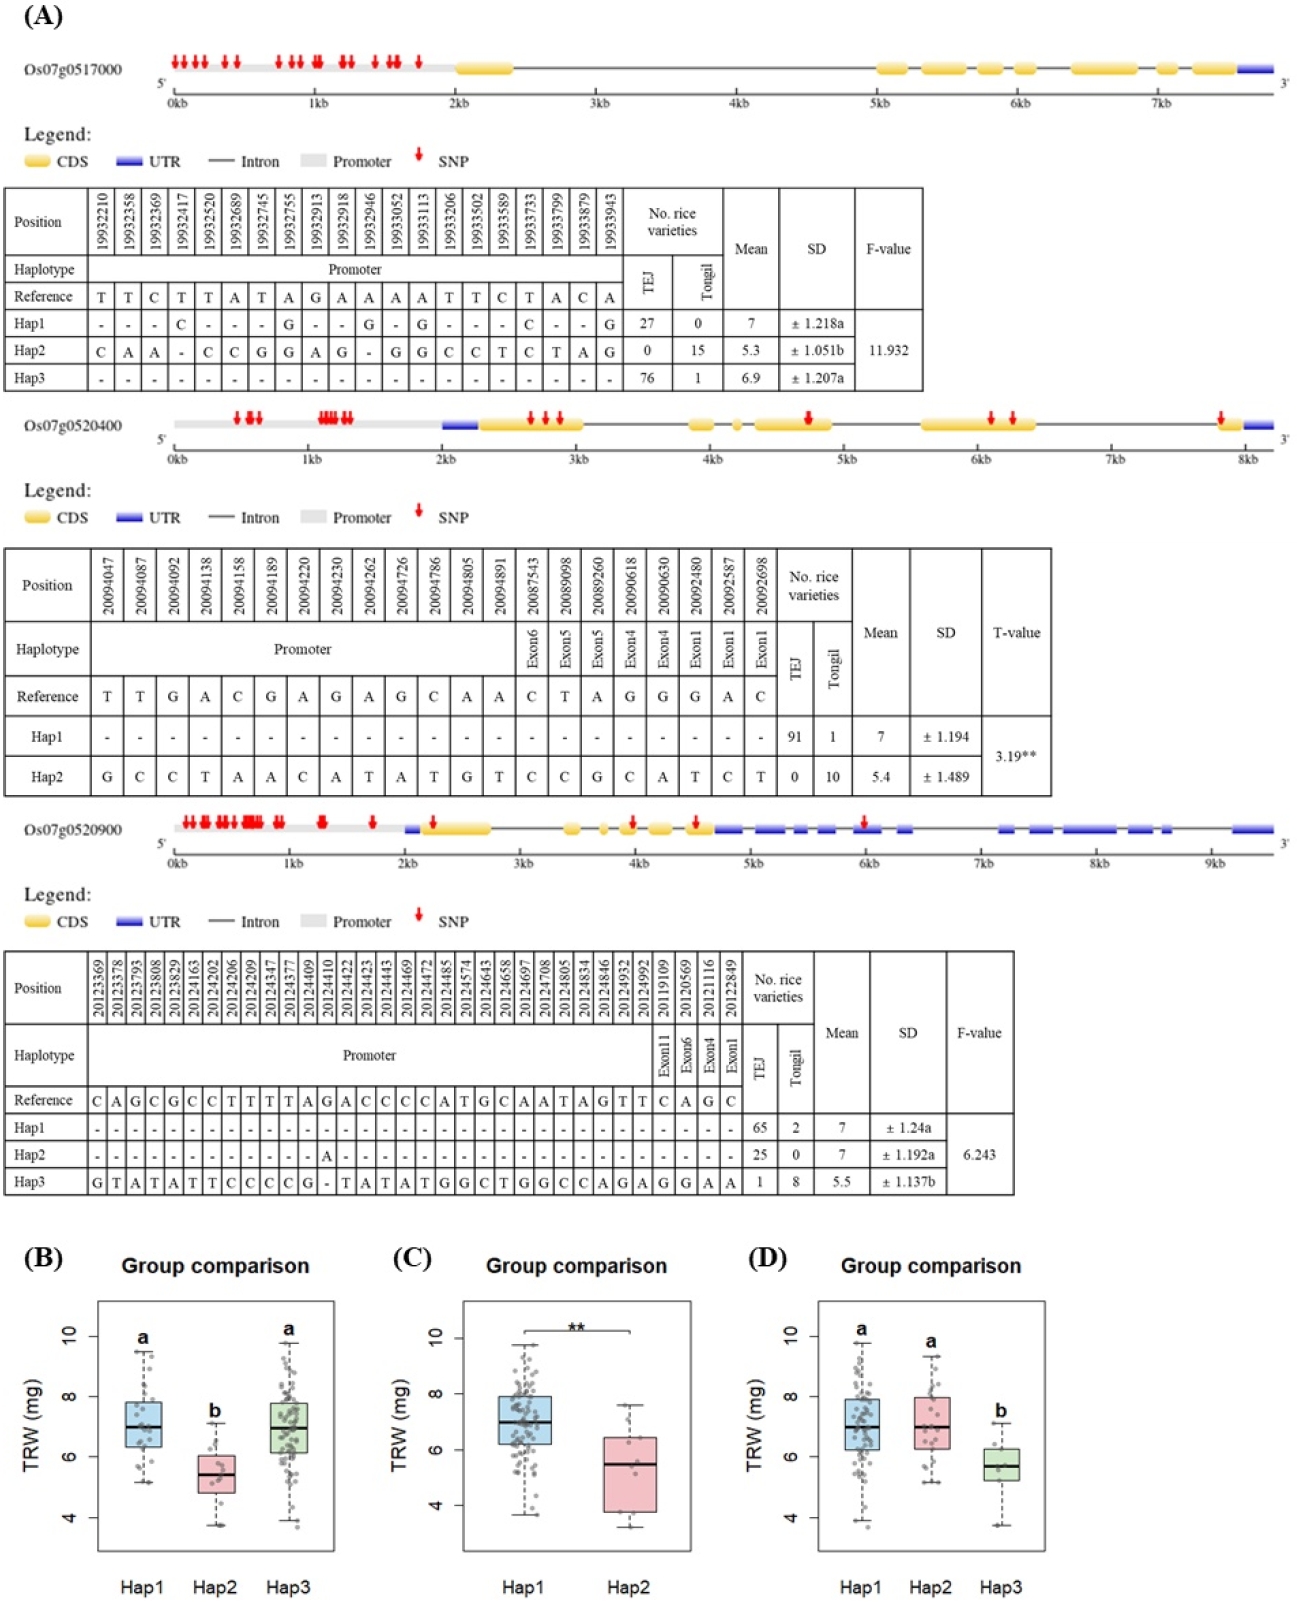
DEAD-box ATP-dependent RNA helicase 32 (OsRH32)로 annotation되어 있으며, 세 개의 하플로타입이 확인되었다(
Fig. 4A). Hap2는 Hap1 및 Hap3보다 낮은 TRW를 나타냈으며, Hap1과 Hap3 사이에는 유의한 차이가 없었다. 그러나 Hap2는 주로 또는 전적으로 Tongil-type 품종으로 구성된 반면, Hap1과 Hap3는 대부분 TEJ 품종으로 구성되었다. 따라서 관찰된 TRW 차이는 해당 유전자의 하플로타입에 의한 독립적인 효과뿐만 아니라 품종군 간 유전적 배경 차이를 반영할 가능성이 있다. 식물의
DExD/H-box RNA helicase는 rRNA processing과 ribosome biogenesis에 관여하며,
Os07g0517000은
DDX10 계열의
ribosome-biogenesis factor와 상동성을 갖는 것으로 보고되어 있다(
Liu & Imai 2018).
Os07g0520400은
potyviral helper component protease-interacting protein 2와 유사한 단백질로 annotation되어 있다. 두 개의 주요 하플로타입이 확인되었으며, Hap1은 Hap2보다 유의하게 높은 TRW를 나타냈다(
p<0.01,
Fig. 4B). 그러나 두 하플로타입은 각각 TEJ와 Tongil-type 품종에 편중되어 분포하였으므로, 하플로타입 효과와 품종군 효과를 명확히 분리하기 어려웠다.
Os07g0520900은
patatin-related phospholipase A I (OspPLAI)로,
galactolipase/phospholipase와 유사한 단백질로 annotation되어 있다.
Os07g0520900에서는 세 개의 하플로타입이 확인되었다(
Fig. 4C). Hap3의 TRW는 Hap1 및 Hap2보다 유의하게 낮았으며, Hap1과 Hap2 사이에는 유의한 차이가 없었다. 그러나 Hap3는 Tongil-type 품종을 포함한 반면, Hap1과 Hap2는 주로 TEJ 품종으로 구성되어 하플로타입 간 차이에 품종군의 유전적 배경이 반영되었을 가능성이 있다. 동일한
patatin-related phospholipase A 계열의 일부 유전자는 벼의 영양기관 생장에 관여하는 것으로 보고되어 있어(
Liu et al. 2015),
Os07g0520900의 뿌리 생장 관련 가능성을 시사하지만 직접적인 기능 검증이 필요하다.
Notes
-
사사
본 연구는 농촌진흥청 국립식량과학원의 공동연구사업(RS-2022-RD010353)의 지원으로 수행되었습니다.
보충자료
본문의 Supplementary Figs. 1-3은 한국육종학회지 홈페이지에서 확인할 수 있습니다.
Supplementary Fig. 2.
Genome-wide association analyses of total root weight (TRW) in 110 temperate japonica (TEJ) rice cultivars. Manhattan plots obtained using FarmCPU, BLINK, and MLM are presented from top to bottom. Each panel shows the -log10(P) values of SNPs across the 12 rice chromosomes. Red arrows indicate association signals detected near the qTRW7 region on chromosome 7. Horizontal dotted lines indicate the genome-wide significance threshold.
KJBS-2026-58-3-275-Supplementary-Fig-1,2.pdf
Supplementary Fig. 3.
Linkage disequilibrium structure of the qTRW7 candidate region on chromosome 7. Pairwise linkage disequilibrium was evaluated among SNPs located between 19.775 and 20.144 Mb on chromosome 7. The upper panel shows the genomic positions of SNPs, and the triangular heatmap represents pairwise r2 values. Red indicates strong linkage disequilibrium (r2 close to 1), whereas yellow and lighter colors indicate progressively weaker linkage disequilibrium.
KJBS-2026-58-3-275-Supplementary-Fig-3.pdf
Fig. 1.Phenotypic variation of maximum root length (MRL) and total root weight (TRW) in Korean rice cultivars. (A) Representative root phenotypes of temperate japonica (TEJ) and Tongil-type rice cultivars. (B) Comparison of MRL between TEJ and Tongil-type cultivars. (C) Frequency distribution of MRL. (D) Comparison of TRW between TEJ and Tongil-type cultivars. (E) Frequency distribution of rank-based inverse normal transformed TRW. Boxplots show the median, interquartile range, and 1.5x interquartile range. Asterisks (***) indicate significant differences between groups at p<0.001.
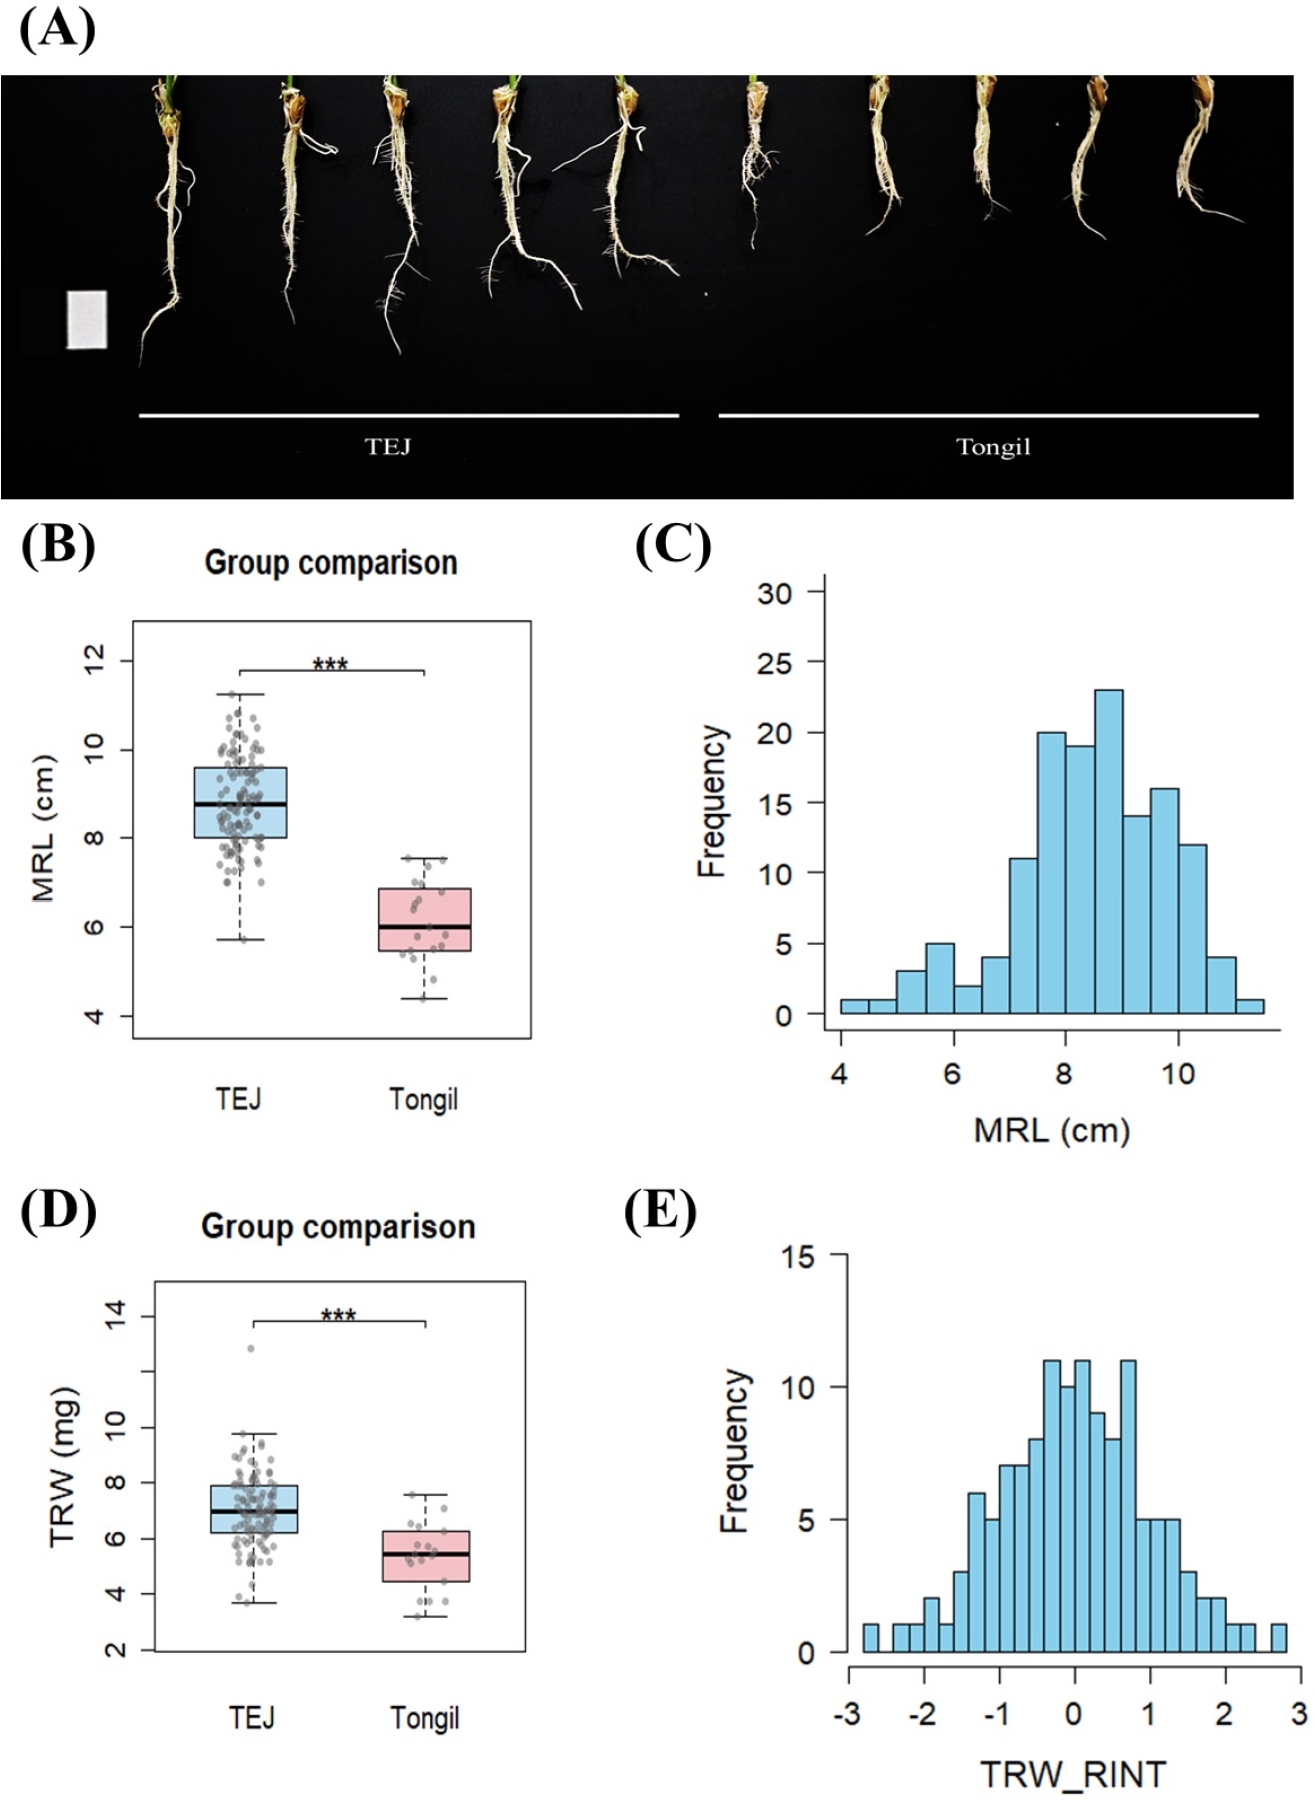
Fig. 2.Population structure and genome-wide association study (GWAS) for MRL and TRW in Korean rice cultivars. (A) Cross-validation (CV) error estimated by ADMIXTURE analysis, showing a marked decrease from K = 1 to K = 2. (B) Principal component analysis (PCA) of 127 Korean rice cultivars. (C) Population structure inferred by ADMIXTURE (K = 2), where each vertical bar represents an individual accession and colors indicate the estimated ancestry proportions. (D) Manhattan plots and quantile-quantile (Q-Q) plots of GWAS for MRL. No significant association signals were detected across the three GWAS models (FarmCPU, BLINK, and MLM). (E) Manhattan plots and Q-Q plots for TRW. A significant association signal was consistently detected on chromosome 7 across the three GWAS models.
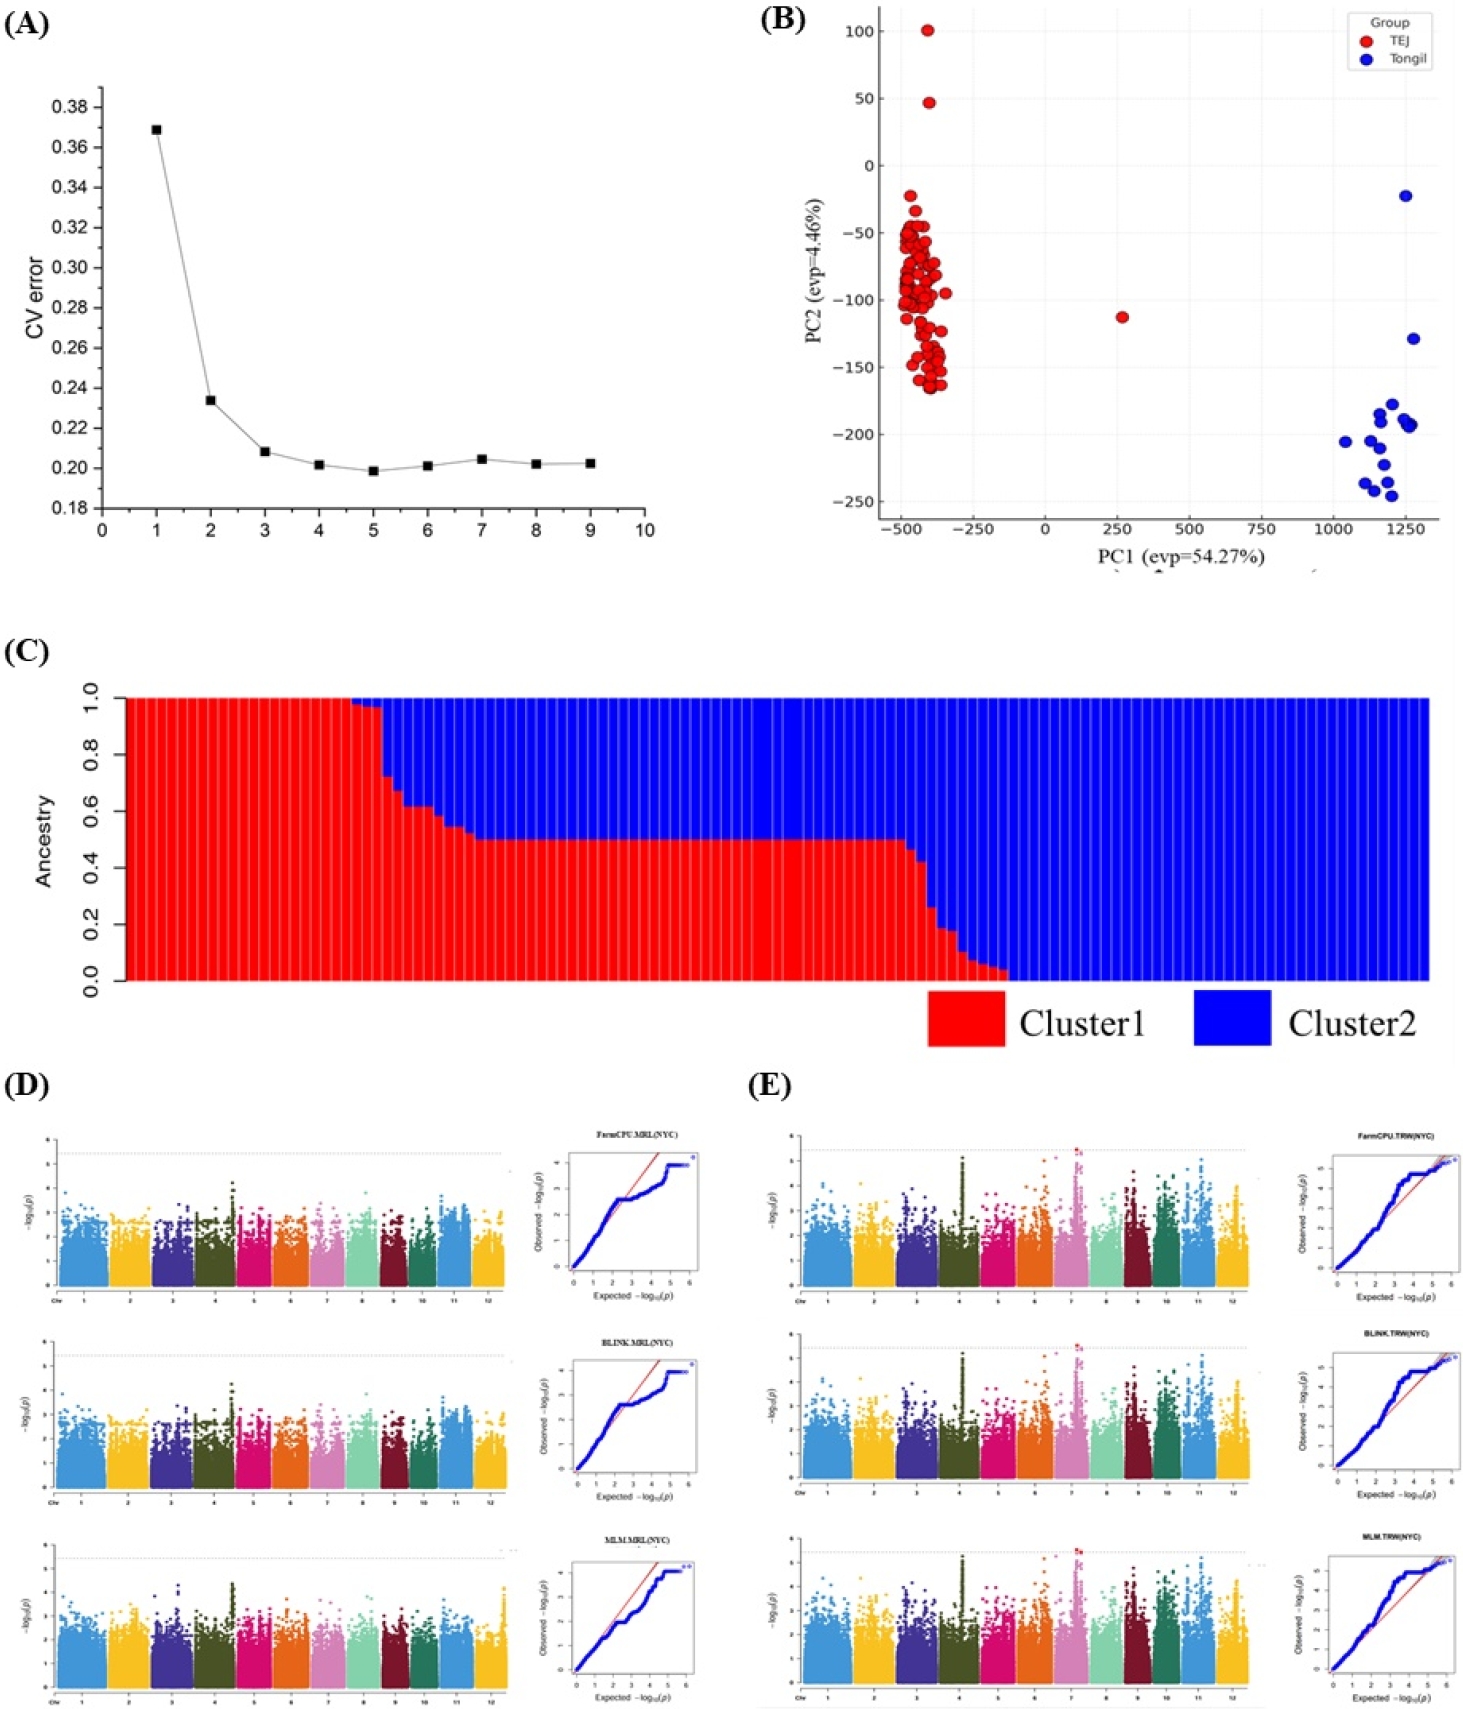
Fig. 3.RNA-seq expression patterns of genes located within the qTRW7 candidate region. (A) Expression profiles based on the E-MTAB-2037 dataset. (B) Expression profiles based on the E-MTAB-4123 dataset. Expression values were normalized within each dataset for visualization. Red and blue indicate relatively high and low expression levels, respectively.
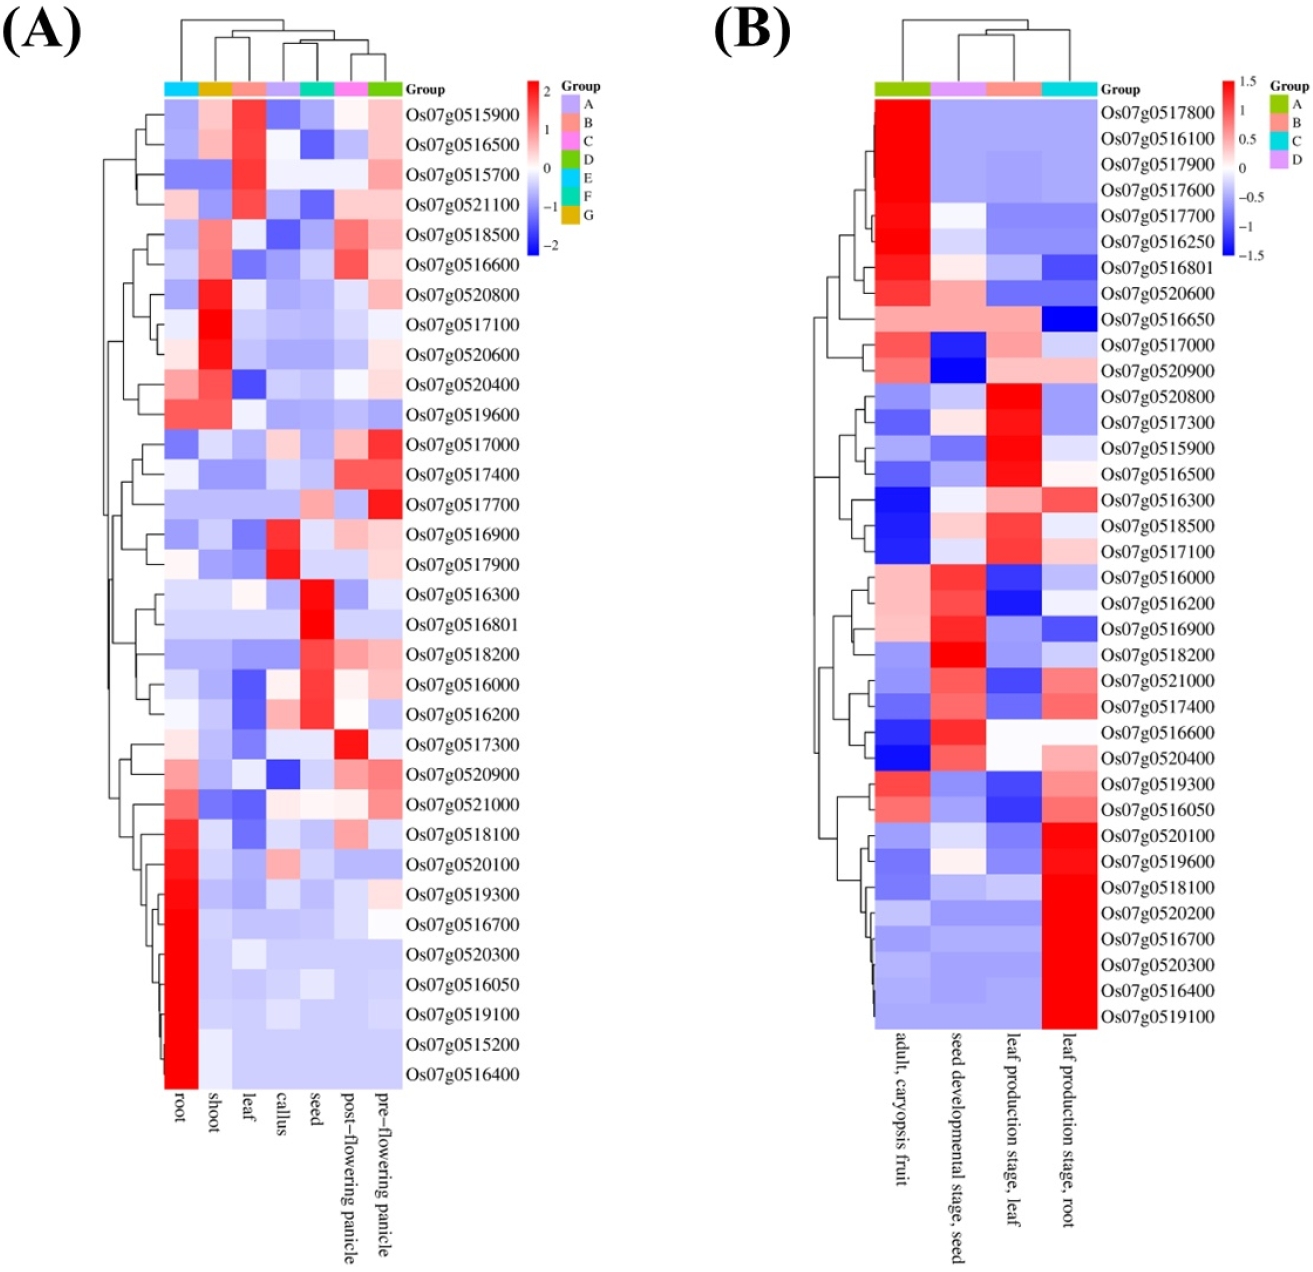
Fig. 4.Gene structures showing SNP distribution and haplotype effects of candidate genes associated with TRW. (A) Os07g0517000, (B) Os07g0520400, and (C) Os07g0520900. For each gene, the gene structure and SNP positions are shown at the top, the haplotype-defining SNPs and corresponding phenotypic statistics are summarized in the table, and TRW distributions among haplotypes are presented as boxplots. Yellow boxes indicate coding sequences (CDS), blue boxes represent untranslated regions (UTRs), gray boxes indicate promoter regions, gray lines represent introns, and red arrows denote SNP positions identified from the resequencing data. Boxplots show the median and interquartile range, with whiskers extending to 1.5 times the interquartile range; individual points represent rice varieties. Different lowercase letters in (A) and (C) indicate significant differences among haplotypes based on Duncan’s multiple range test (p<0.05). In (B), double asterisks indicate a significant difference between haplotypes based on Student’s t-test (**p<0.01).
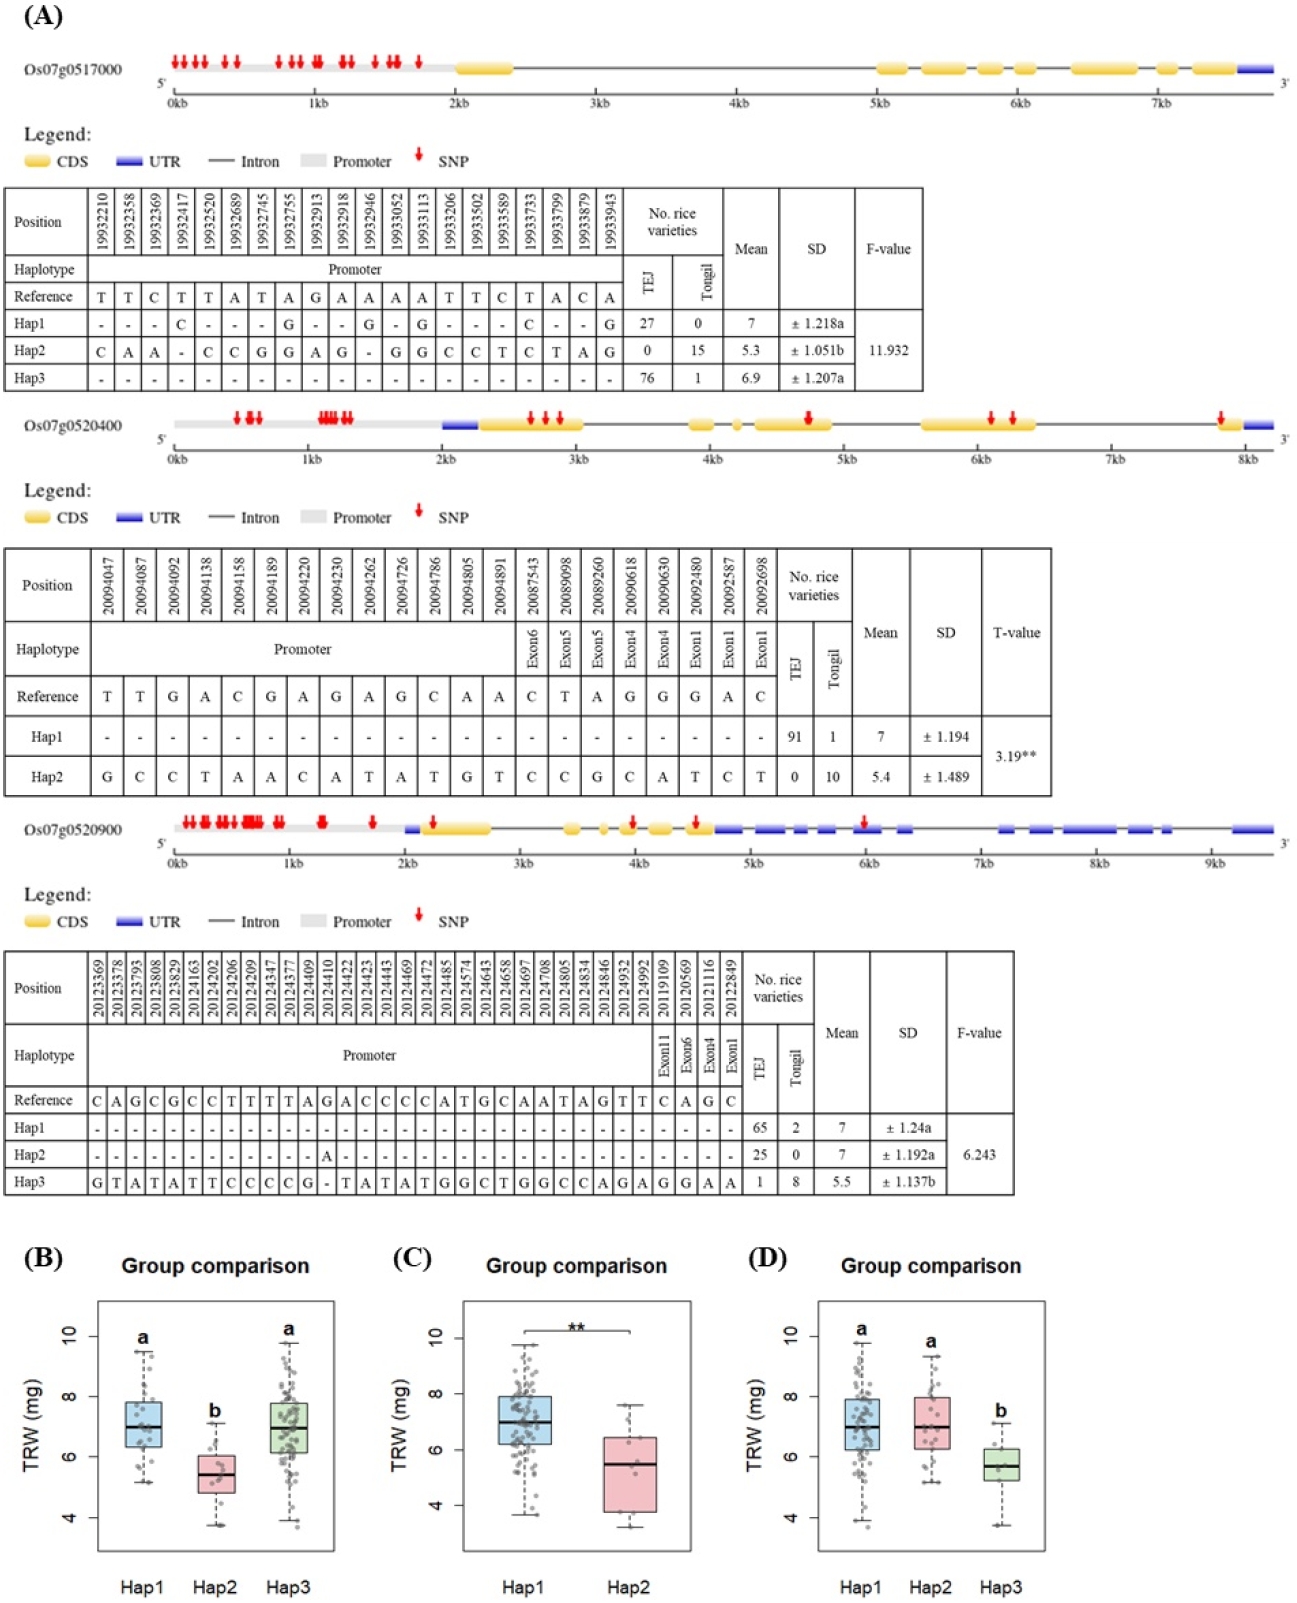
Table 1.Distribution of MRL and TRW.
Table 1.
|
Maximum root length (cm) |
Total root weight (mg) |
|
Maximum |
11.23 |
12.87 |
|
Minimum |
4.30 |
3.20 |
|
Average±SD |
8.43±1.37 |
6.81±1.43 |
References
- 1. Alexander DH, Novembre J, Lange K. 2009. Fast model-based estimation of ancestry in unrelated individuals. Genome Res 19: 1655-1664.
- 2. Bandumula N. 2018. Rice production in asia: Key to global food security. Proc Natl Acad Sci, India Sect B Biol Sci 88: 1323-1328.
- 3. Beasley TM, Erickson S, Allison DB. 2009. Rank-based inverse normal transformations are increasingly used, but are they merited? Behav Genet 39: 580-595.
- 4. Calleja-Cabrera J, Boter M, Oñate-Sánchez L, Pernas M. 2020. Root growth adaptation to climate change in crops. Front Plant Sci 11: 544.
- 5. Comas LH, Becker SR, Cruz VMV, Byrne PF, Dierig DA. 2013. Root traits contributing to plant productivity under drought. Front Plant Sci 4: 442.
- 6. Coudert Y, Périn C, Courtois B, Khong NG, Gantet P. 2010. Genetic control of root development in rice, the model cereal. Trends Plant Sci 15: 219-226.
- 7. Courtois B, Audebert A, Dardou A, Roques S, Ghneim-Herrera T, Droc G, Frouin J, Rouan L, Gozé E, Kilian A, Ahmadi N, Dingkuhn M. 2013. Genome-wide association mapping of root traits in a japonica rice panel. PLoS One 8: e78037.
- 8. Dong S-S, He W-M, Ji J-J, Zhang C, Guo Y, Yang T-L. 2021. LDBlockShow: A fast and convenient tool for visualizing linkage disequilibrium and haplotype blocks based on variant call format files. Brief Bioinform 22: bbaa227.
- 9. Du M, Zhang W, Gao J, Liu M, Zhou Y, He D, Zhao Y, Liu S. 2022. Improvement of root characteristics due to nitrogen, phosphorus, and potassium interactions increases rice (Oryza sativa L.) yield and nitrogen use efficiency. Agronomy 12: 23.
- 10. Gowda VRP, Henry A, Yamauchi A, Shashidhar HE, Serraj R. 2011. Root biology and genetic improvement for drought avoidance in rice. Field Crops Res 122: 1-13.
- 11. Huang M, Liu X, Zhou Y, Summers RM, Zhang Z. 2019. BLINK: A package for the next level of genome-wide association studies with both individuals and markers in the millions. GigaScience 8: giy154.
- 12. Kim PS, Kim DM, Kang JW, Lee HS, Ahn SN. 2015. QTL mapping of rice root traits at different NH4+ levels in hydroponic condition. Plant Breed Biotech 3: 244-252.
- 13. Leigh JW, Bryant D. 2015. Popart: Full-feature software for haplotype network construction. Methods Ecol Evol 6: 1110-1116.
- 14. Li X, Guo Z, Lv Y, Cen X, Ding X, Wu H, Li X, Huang J, Xiong L. 2017. Genetic control of the root system in rice under normal and drought stress conditions by genome-wide association study. PLoS Genet 13: e1006889.
- 15. Lipka AE, Tian F, Wang Q, Peiffer J, Li M, Bradbury PJ, Gore MA, Buckler ES, Zhang Z. 2012. GAPIT: Genome association and prediction integrated tool. Bioinformatics 28: 2397-2399.
- 16. Liu G, Zhang K, Ai J, Deng X, Hong Y, Wang X. 2015. Patatin-related phospholipase A, pPLAⅢα, modulates the longitudinal growth of vegetative tissues and seeds in rice. J Exp Bot 66: 6945-6955.
- 17. Liu X, Huang M, Fan B, Buckler ES, Zhang Z. 2016. Iterative usage of fixed and random effect models for powerful and efficient genome-wide association studies. PLoS Genet 12: e1005767.
- 18. Liu Y, Imai R. 2018. Function of plant DExD/H-Box RNA helicases associated with ribosomal RNA biogenesis. Front. Plant Sci 9: 125.
- 19. Meng F, Xiang D, Zhu J, Li Y, Mao C. 2019. Molecular mechanisms of root development in rice. Rice 12: 1.
- 20. Purcell S, Neale B, Todd-Brown K, Thomas L, Ferreira MAR, Bender D, Maller J, Sklar P, de Bakker PIW, Daly MJ, Sham PC. 2007. PLINK: A tool set for whole-genome association and population-based linkage analyses. Am J Hum Genet 81: 559-575.
- 21. Sakai H, Mizuno H, Kawahara Y, Wakimoto H, Ikawa H, Kawahigashi H, Kanamori H, Matsumoto T, Itoh T, Gaut BS. 2011. Retrogenes in rice (Oryza sativa L. ssp. japonica) exhibit correlated expression with their source genes. Genome Biol Evol 3: 1357-1368.
- 22. Xu X, Ye J, Yang Y, Zhang M, Xu Q, Feng Y, Yuan X, Yu H, Wang Y, Yang Y, Wei X. 2020. Genome-wide association study of rice rooting ability at the seedling stage. Rice 13: 59.
- 23. Yoshida S, Forno DA, Cock JH, Gomez KA. 1976. Laboratory manual for physiological studies of rice. 3rd ed. International Rice Research Institute, Los Baños, Philippines.
- 24. Yun YT, Kim HJ, Tai TH. 2019. Identification of QTLs controlling seedling traits in temperate japonica rice under different water conditions. Plant Breed Biotech 7: 106-122.
- 25. Zhang H, San ML, Jang S-G, Lee J-H, Kim N-E, Lee A-R, Park S-Y, Cao F-Y, Chin J-H, Kwon S-W. 2020. Genome-wide association study of root system development at seedling stage in rice. Genes 11: 1395.
- 26. Zhang Y-C, Liao J-Y, Li Z-Y, Yu Y, Zhang J-P, Li Q-F, Qu L-H, Shu W-S, Chen Y-Q. 2014. Genome-wide screening and functional analysis identify a large number of long noncoding RNAs involved in the sexual reproduction of rice. Genome Biol 15: 512.
- 27. Zhang Z, Ersoz E, Lai C-Q, Todhunter RJ, Tiwari HK, Gore MA, Bradbury PJ, Yu J, Arnett DK, Ordovas JM, Buckler ES. 2010. Mixed linear model approach adapted for genome-wide association studies. Nat Genet 42: 355-360.
Citations
Citations to this article as recorded by