적요
-
본 연구는 귀리 유전자원 481점의 주요 농업적 형질을 평가하고 교배 모본으로 활용할 우수 계통(Elite lines)을 선발하고자 수행되었으며 주요 결과는 다음과 같다.
1. 11개 양적 형질과 7개 질적 형질을 평가한 결과, 출수기, 지엽 너비 및 길이, 이삭 길이, 초장 등에서 2.0 이상의 높은 섀넌 다양성 지수(H')를 나타내어 유전자원 내 다양한 농업적 형질을 나타내었다.
2. 주요 농업적 형질 간의 상관관계 및 회귀 분석 결과, 출수기, 초장, 잎의 크기, 이삭 길이 등 수량성과 관련된 형질 간 뚜렷한 양의 상관관계가 관찰되었다.
3. 핵심 농업 형질에 대한 주성분 분석 결과, 제1주성분(초장, 이삭 길이)과 제2주성분(지엽 길이, 출수기)이 전체 표현형 변이의 78.4%를 설명하고, 선발된 우수 계통들의 뚜렷한 군집을 형성하였다.
4. 3가지 복합 형질 기준(Biomass, Yield-potential, Early-development)을 적용하여 총 36개의 우수 계통을 선발하였다. 이 중 두 가지 기준을 동시에 충족하는 7개의 복합 우수 계통(Double Elites)은 높은 수준의 수량성이 기대되며, 특히 OG317, OG113을 포함한 5개 계통은 지엽이 커서 사료적 가치가 우수할 것으로 기대된다.
5. 선발 계통 중 ‘OG391’과 ‘OG204’는 표준 품종인 하이스피드(OG001)와 비교하여 수량성이 대등하면서도 출수기가 빨랐으며, 이는 향후 국내 이모작 작부체계에 적합한 조숙성 우수 교배 모본으로 활용 가능할 것으로 기대된다.
Abstract
This study aimed to provide foundational data for breeding new high-yielding and early-maturing oat varieties suitable for domestic environments by evaluating the quantitative and qualitative traits of 481 oat accessions and selecting elite lines. Descriptive statistics and diversity index analyses revealed a wide range of genetic variation in traits related to heading date, flag leaves, and panicles. Correlation analysis of the major agronomic traits revealed distinct positive correlations among yield-related traits, including plant height, leaf size, and panicle length. Based on key agronomic traits, principal component analysis (PCA) demonstrated that the first and second principal components accounted for 78.4% of the total phenotypic variation. Finally, 36 elite accessions were selected based on three combined traits: biomass, yield potential, and early development. Among them, seven double elite lines (OG318, OG317, OG113, OG523, OG289, OG320, and OG117) exhibited significantly taller plant heights, longer panicle lengths, and higher biomass, making them highly suitable for breeding high-yielding varieties. Notably, the single elite lines, ‘OG391’ and ‘OG204’, demonstrated early-maturing characteristics while maintaining yield potential comparable to that of the standard variety, making them highly valuable resources for the domestic double-cropping system. Overall, the selected elite lines will serve as valuable crossing parents for future oat breeding programs.
-
Key words: Avena sativa L., genetic diversity, principal component analysis, resource evaluation, elite lines
서언
국립식량과학원에서 500여 점 이상의 귀리 유전자원을 보유하고 있으나, 지금까지 다양한 자원에 대한 종합적인 농업적 형질 평가 및 육종 소재 활용에 따른 목적별 농업형질 조사는 다소 미흡한 실정이었다. 이에 본 연구는 보유 중인 귀리 유전자원 481점을 대상으로 주요 농업적 형질(출수기, 초장, 수량 구성 요소 등)의 다양성을 평가하고, 형질 간 상관 분석을 수행하였다. 또한, 표준품종과의 비교를 통해 각 형질에서 우수한 특성을 보여 육종 모본으로서 가치가 높은 유망 육종 소재(Promising breeding materials)를 선발하고, 이들 자원의 향후 육종 활용 가치를 제시하고자 하였다.
재료 및 방법
시험재료 및 재배 방법
본 연구에는 국립식량과학원(NICS) 기초식량작물부 중북부작물연구센터에서 보존 중인 귀리 유전자원 507점을 공시재료로 하였다. 표준품종으로는 국내 육성 품종인 봄 파종형 ‘하이스피드’를 공시하였고, ‘삼한’을 대비품종으로 공시하였다. 본 연구에서는 국내 대표적인 가을 파종형 품종인 ‘삼한’을 대비품종으로 포함시킨 것은 평가된 유전자원 집단이 가지는 넓은 형태적 변이 스펙트럼 내에서 ‘삼한’을 참고하였기 때문이다. 공시 자원은 2025년 3월 7일 국립식량과 학원 중북부작물연구센터 시험포장(수원)에서 파종하였다. 재배는 1 m 열에 10 cm 간격으로 점파하였으며, 5반복으로 수행하였다. 시비는 N-P2O5-K2O (22-12-5) 복합비료를 30 kg/ha 밑거름으로 시비하였고, 웃거름으로 질소를 30 kg/10a 시비하였으며, 기타 병해충 관리는 농촌진흥청 맥류 표준재배법에 준하였다.
형질 조사
귀리 표현형 형질 조사는 농촌진흥청의 농업과학기술 연구조사분석기준(RDA 2012)에 준하였다. 조사 형질은 11개의 양적 형질(출수시, 출수기, 성숙기, 초장, 이삭 길이, 지엽 길이, 지엽 너비, 이삭 밀도, 천립중, 외영 길이, 외영 폭)과 7개의 질적 형질(생장 습성, 늘어진 지엽 빈도, 엽초의 백분체, 이삭 모양, 지경의 직립 자세, 탈립 정도, 외영의 색)로 구분하여 총 18형질을 조사하였다. 각 형질의 세부적인 조사 분석 기준은
Supplementary Tables 1,
2에 요약하였다.
조사된 데이터 중 발아가 불량하여 재파종을 실시한 26점은 생육 단계가 타 자원과 비교하여 현저히 늦어져서 분석에서 제외하였다. 귀리 유전자원 481점의 형질 조사 데이터에 대한 기초 통계량인 평균, 표준편차, 변이계수는 Microsoft Excel 2024 (Microsoft Corp., Redmond, WA, USA)를 이용하여 산출하였으며, 이후의 모든 통계 분석 및 시각화는 R (Version 4.3.3, R Core Team 2025) 프로그램을 사용하였다. 사용된 R 프로그램과 각 패키지들은 방대한 유전자원의 특성을 통계적으로 요약하고, 품종 간의 유의미한 차이와 형질 간의 연관성을 직관적으로 해석하는 데 활용되었다.
유전자원의 유전적 다양성을 평가하기 위해
vegan 패키지를 이용하여 섀넌 다양성 지수(Shannon’s diversity index, H’)와 피엘루의 균등도 지수(Pielou’s evenness index, J’)를 계산하였다. 양적 형질은 각 형질의 전체 데이터 범위(최솟값-최댓값)를 10개의 동일한 간격으로 범주화한 후, 각 구간의 빈도수를 기반으로 H’지수를 산출하였고(
Shannon 1948), 질적 형질은 조사된 각 범주를 기준으로 빈도수를 집계하여 H’지수를 계산하였다. 또한 각 양적형질의 정규분포 여부 및 데이터의 편중성을 확인하기 위해 왜도(Skewness)와 첨도(Kurtosis)를 산출하였다. 일반적으로 왜도의 절댓값이 2미만, 첨도의 절댓값이 7미만일 경우 정규분포를 가정할 수 있는 것으로 간주하였다(
Curran et al. 1996). 5반복으로 조사된 양적 형질에 대해서는 통계 프로그램을 이용하여 일원배치 분산 분석(One-way ANOVA)을 수행하였다. 분산 분석 결과, 유의성이 확인된 형질(
p<0.05)에 대해서는 표준품종인 하이스피드(OG001)을 대조군으로 설정하여 던넷(Dunnett)의 사후검정을 수행하였다. 주요 양적 형질 간의 상호 관계를 분석하기 위해 피어슨(Pearson)의 상관계수를 계산하였으며, corrplot 패키지를 이용해 상관관계 히트맵(heatmap)을 나타내었고, ggplot2 패키지를 이용해 산점도(scatter plot)로 표현하였다. 또한, 481개 유전자원의 전체적인 분포 양상과 형질 간의 관계를 종합적으로 파악하기 위해 주성분 분석(Principal Component Analysis, PCA)을 수행하였으며, 그 결과를
tidyverse와
ggfortify 패키지를 이용하여 바이플롯(biplot)으로 나타내었다.
결과 및 고찰
표현형 변이 및 유전적 다양성
본 연구에서는 귀리 유전자원 481점에 대하여 11개의 양적 형질과 7개의 질적 형질을 조사하였다. 양적 형질에 대한 기술 통계 및 섀넌 다양성 지수(Shannon’s diversity index, H’)를 분석한 결과, 평가된 자원은 유전적 다양성을 보였다. 특히 출수시, 지엽 너비, 지엽 길이, 이삭 길이, 초장 등의 형질에서 다양성 지수가 2.0 이상으로 매우 높았다(
Table 1). 이는 수집된 귀리 유전자원이 해당 잎 및 이삭 관련 형질들에 대해 폭넓은 변이를 보유하고 있음을 의미한다. 또한, 7개의 질적 형질(생장 습성, 늘어진 지엽 빈도, 엽초의 백분체, 이삭 모양, 지경의 직립 자세, 탈립 정도, 외영의 색)에 대한 빈도 분포를 분석한 결과에서도 자원 간 뚜렷한 형태적 다양성이 확인되었다. 특히, 탈립 정도에서는 탈립이 잘 안되는 자원의 비율이 95.6%로 가장 높았는데, 이는 유전자원이 야생종보다는 재배종이나 육성 계통 위주로 구성되어 있음을 보여준다. 엽초의 백분체의 경우 다양한 표현형이 비교적 고르게 분포하는 양상을 보였다(
Table 2). 이러한 양적 형질의 폭넓은 변이와 질적 형질의 다양성은 향후 귀리 품종 육성을 위한 교배 모본 선정 시 유용한 기초 자료로 활용될 수 있음을 시사한다.
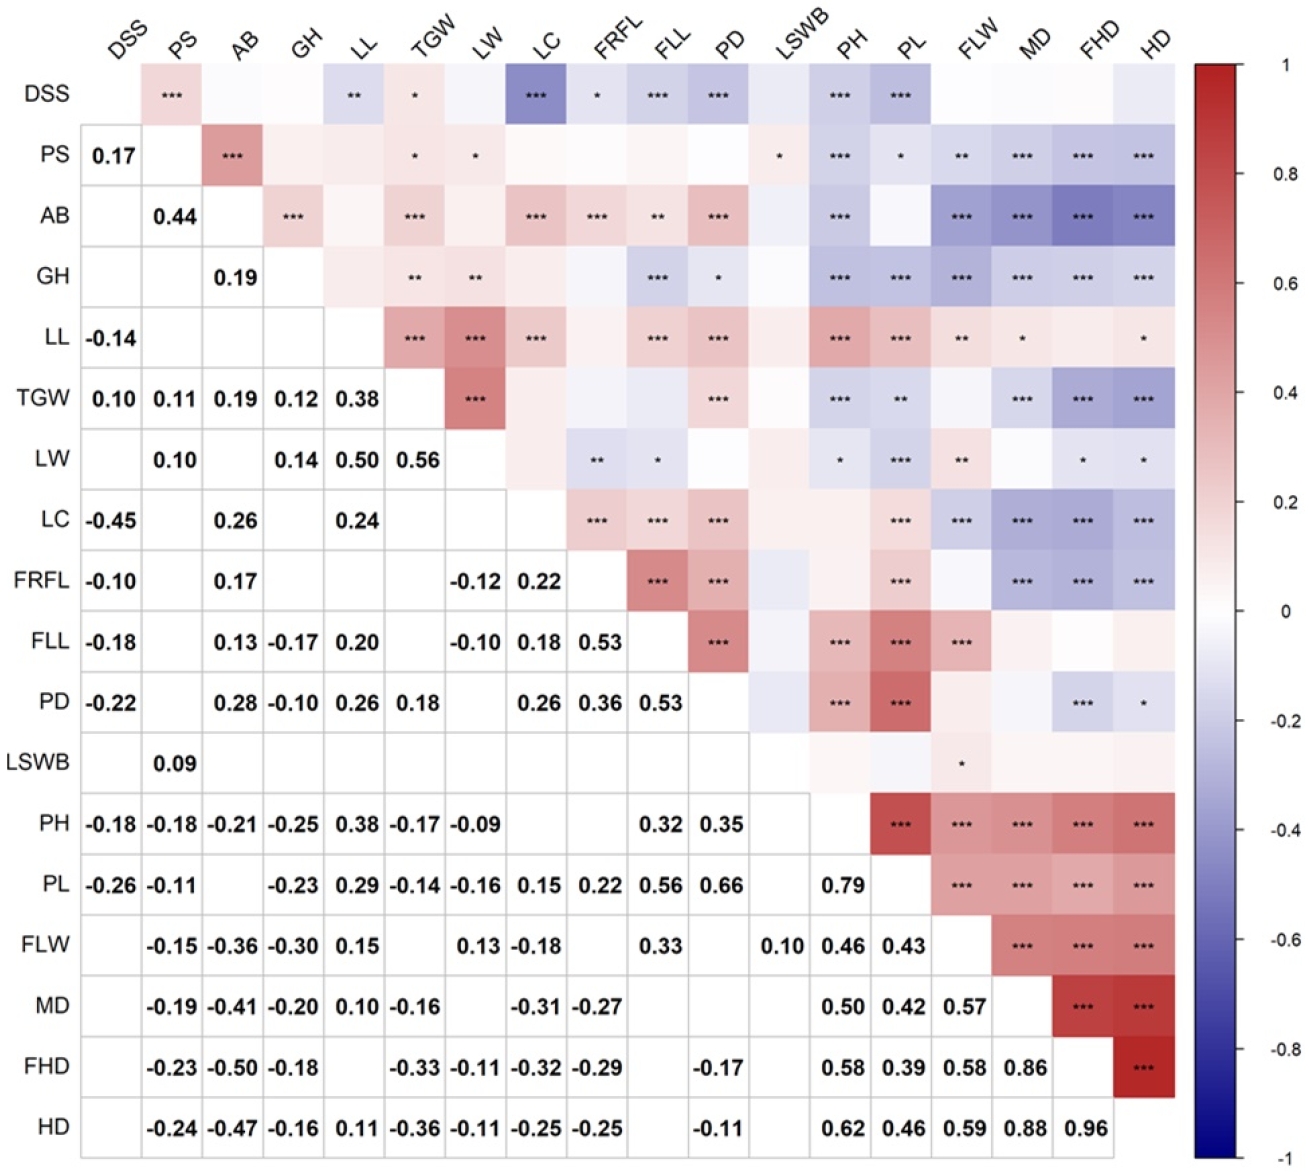
귀리 유전자원 481점의 주요 농업 형질 간 연관성을 확인하기 위하여 피어슨 상관계수(Pearson's correlation coefficient) 를 산출하여 히트맵(Heatmap)으로 시각화하였다(
Fig. 1). 출수기, 성숙기, 초장, 이삭 길이 등 조사된 주요 양적 및 질적 형질들 사이에서 다양한 수준의 유의미한 상관관계가 있었다. 특히 생육 기간을 나타내는 출수기 및 형태적 발달을 나타내는 초장, 잎의 크기, 이삭 관련 형질 간에 뚜렷한 양의 상관관계를 나타내었다.
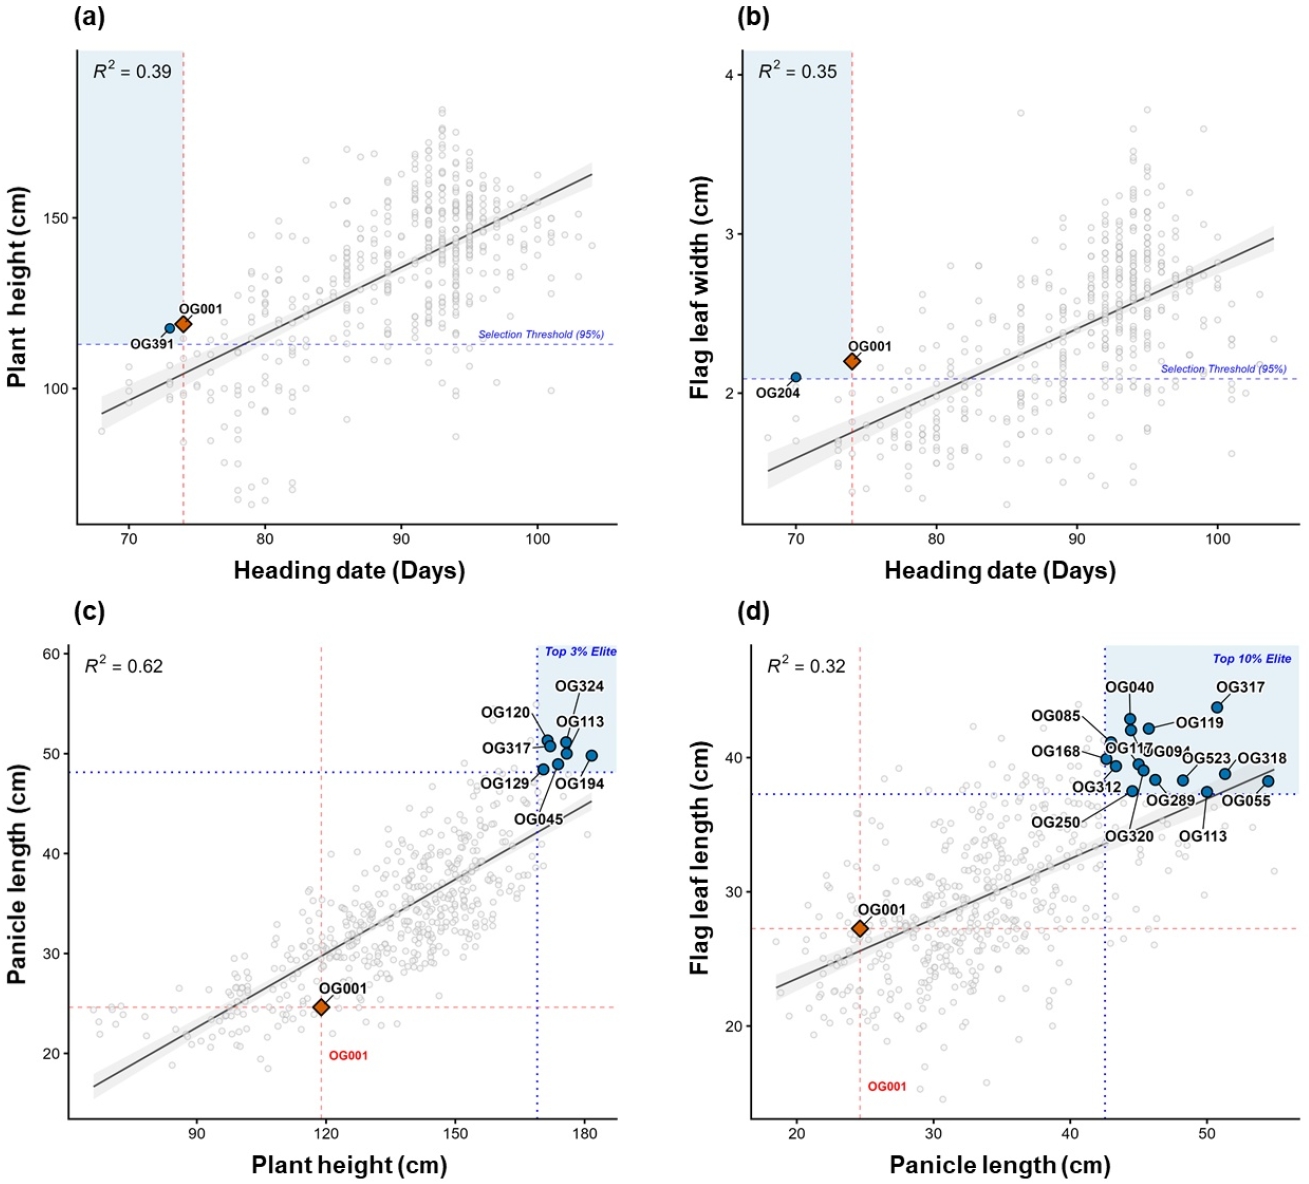
이러한 주요 농업적 형질 간의 양의 상관관계를 바탕으로 선형 회귀 분석을 수행하고, 특정 기준을 충족하는 우수 계통(elite lines)을 선발하였다(
Fig. 2). 전체 집단 내 유전자원의 형질 분포를 표준 품종인 하이스피드(OG001)와 비교 분석한 결과는 다음과 같다.
첫째, 출수기와 초장 간에는 유의미한 양의 상관관계(R
2=0.39)로, 초장이 95% 신뢰구간 선발 기준을 만족하는 영역 내에서 출수기가 대표 품종보다 빠른 우수 계통(OG391)을 선발하였다(
Fig. 2a). 둘째, 출수기와 지엽 너비 사이에서 도 유사한 수준의 양의 상관관계(R
2=0.35)로, 동일한 95% 선발 기준 하에 출수기가 표준 품종보다 빠른 우수 계통(OG204)을 선발하였다(
Fig. 2b). 셋째, 초장과 이삭 길이는 조사된 형질 간에 뚜렷한 양의 상관관계(R
2=0.62)로, 식물체의 키가 클수록 이삭의 길이도 뚜렷하게 증가하는 상위 3% 범위에 해당하는 우수 계통(OG317, OG113 등)을 선발하였다(
Fig. 2c). 마지막으로, 이삭 길이와 지엽 길이 또한 양의 상관관계(R
2=0.32)로, 상위 10% 범위에 해당하는 우수 계통(OG318, OG320 등)을 추가로 선발하였다(
Fig. 2d).
결과적으로, 귀리의 초장, 잎의 크기(지엽 길이와 너비), 이삭 길이 등 수량성과 직결되는 주요 형질은 서로 밀접하게 연관되어 동반 상승하는 생장 패턴을 보여주었다. 도출된 형질 간 상관관계와 회귀 모델, 그리고 이를 통해 확인된 우수 계통들은 향후 귀리 신품종 육성을 위한 교배 모본 선정 및 간접 선발 지표로 유용하게 활용할 수 있을 것이다.
유전자원 다양성 평가 및 주요 농업적 형질의 주성분 분석
수집된 귀리 유전자원의 전체적인 유전적 다양성을 포괄적으로 이해하기 위해 양적 및 질적 형질 전체를 대상으로 주성분 분석을 하였다(
Supplementary Table 3). 그 결과, 총 18개의 다양한 양적, 질적 형질들이 복합적으로 작용하여 제1주성분(PC1)이 전체 표현형 변이의 26.33%, 제2주성분(PC2)이 17.5%를 차지하여 전체 유전자원의 약 44%의 넓은 변이 폭을 설명하였다. 다양한 질적 형질이 포함된 전체 데이터의 주성분 분석은 유전자원의 전반적인 분류를 확인하는 데에 의미가 있지만, 다수성 품종 개발과 같은 특정 육종 목적과의 인과관계를 설명하는 데는 한계가 있다.
따라서, 조사한 모든 형질의 다양성 양상을 바탕으로, 실질적으로 육종에 활용할 수 있는 선발 지표로서 가치가 높은 주요 농업적 형질(key agronomic traits)에 초점을 맞추어 형질 간의 복합적인 관계를 구명하고자 추가적인 주성분 분석을 하였다(
Table 3,
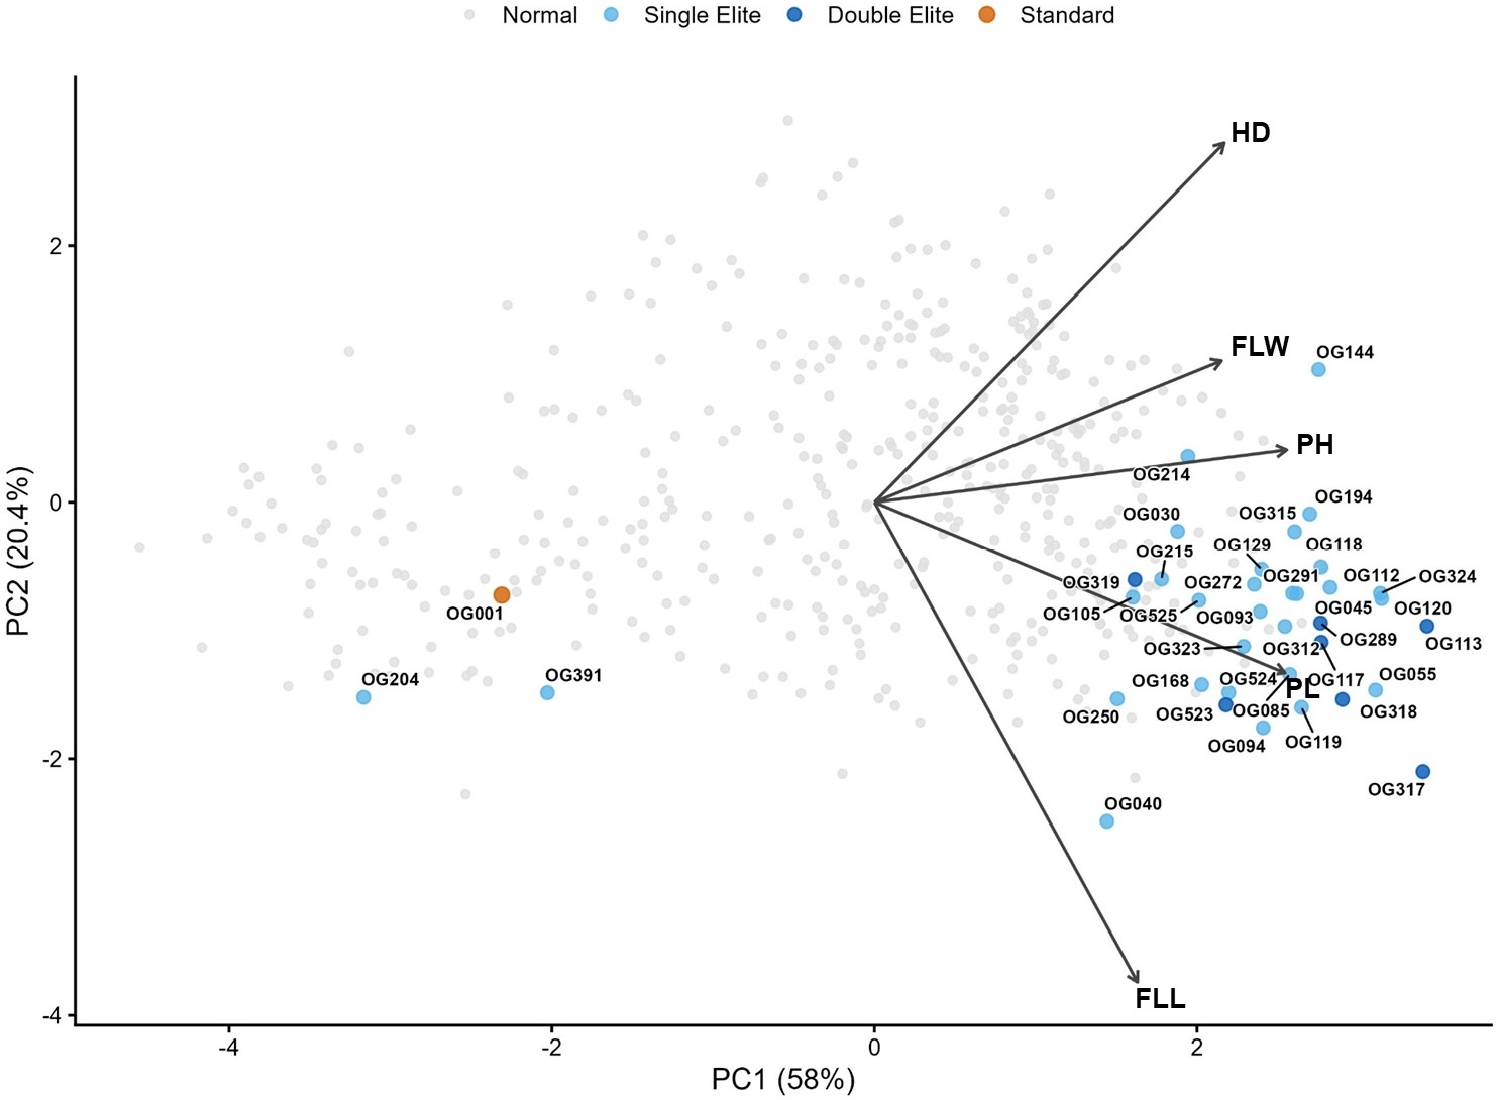
Fig. 3). 분석 결과, 제1주성분(PC1)과 제2주성분(PC2)은 전체 표현형 변이의 각각 58.0%와 20.4%를 설명하여, 두 주성분만으로도 누적 기여율이 78.4%에 달하였다.
Table 3의 고유벡터(Eigenvector) 값으로 보아, PC1은 주로 초장과 이삭 길이와, PC2는 지엽 길이, 출수기와 높은 연관성이 있었다.
이러한 형질들의 특성은 PCA 바이플롯(biplot)으로 가시화하였다. 표준 품종(Standard, OG001)을 기준으로, 총 481점의 전체 유전자원(Normal)은 넓은 변이 폭을 보이며 폭넓게 분포하였다. 특히, OG391과 OG204를 제외한 주요 농업적 형질이 우수한 단일 우수 계통(Single Elite)과 두 개 이상의 선발 기준을 모두 충족하는 복합 우수 계통(Double Elite)들이 뚜렷한 군집을 형성하며 출수기(HD), 지엽 너비(FLW), 초장(PH), 이삭 길이(PL), 지엽 길이(FLL)에 해당하는 주요 농업적 형질 벡터 방향과 일치하는 위치에 분포하였다. 이는 본 연구에서 설정한 선발 기준이 유전자원의 우수한 표현형 특성을 효과적으로 반영하고 있음을 시사한다.
우수 계통 선발 및 특성 평가
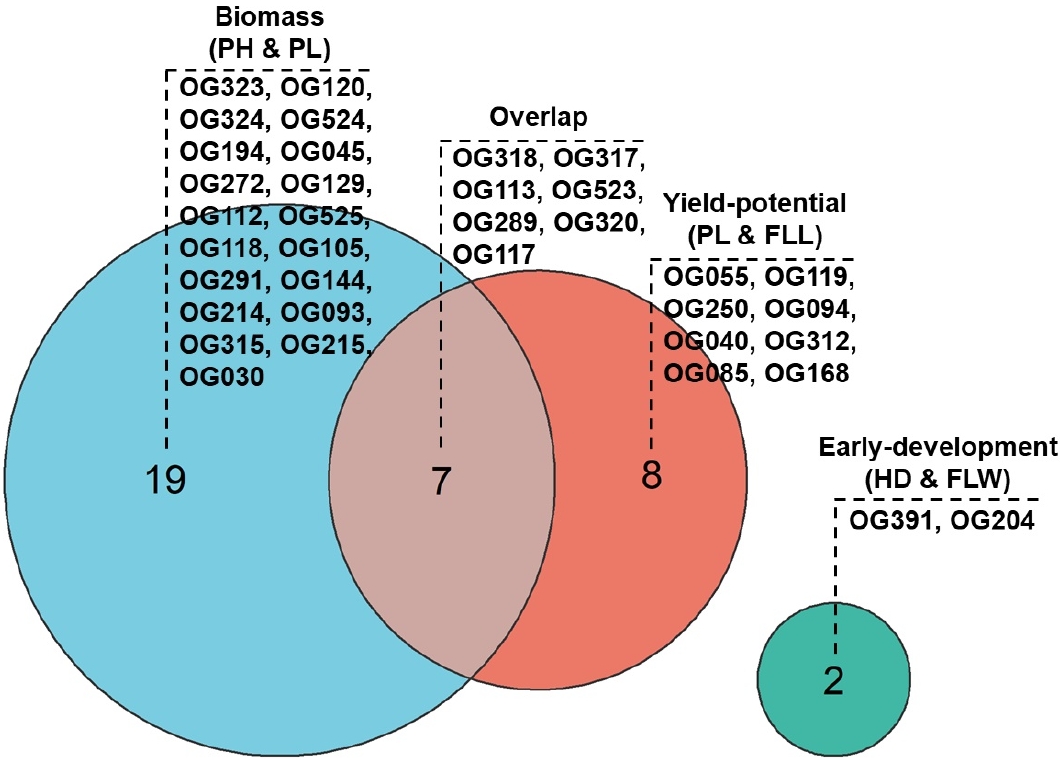
주성분 분석 결과를 바탕으로, 육종 목적에 부합하는 총 36개의 우수 계통을 최종 선발하였으며, 3가지 복합 형질 기준(Biomass, Yield-potential, Early-development)에 따른 계통들의 분포와 중복성을 오일러 다이어그램(Euler diagram)으로 나타내었다(
Fig. 4). 초장과 이삭 길이가 우수한 ‘Biomass’ 그룹에는 19개의 계통, 이삭 길이와 지엽 길이가 우수한 ‘Yield-potential’ 그룹에는 8개의 계통이 각각 단일 우수 계통(Single Elites)으로 구분되었다. 주목할 만한 점은, 이 두 가지 선발 기준을 모두 충족하는 7개의 계통이 복합 우수 계통(Double Elites)으로 확인되었다는 것이다. 반면, 출수기와 초장 및 지엽 폭을 기준으로 한 ‘Early-development’ 그룹에는 2개의 계통만이 선발되었으며 타 그룹과의 중복은 없었다.
선발된 단일 및 복합 우수 계통들의 실제 농업적 가치를 검증하기 위해 표준 품종(OG001)과 주요 형질을 비교하였다(
Table 4). 비교 결과, 선발된 복합 우수 계통들은 전반적으로 표준 품종보다 유의미하게 초장, 이삭 길이와 지엽 길이가 길었다. 그 중 OG317, OG113, OG289, OG320, OG117 계통은 지엽 너비 또한 유의미한 차이가 있어 사료적 가치 및 수량성이 더욱 높을 것으로 기대된다. 특히, 선발 계통 중 ‘OG391’과 ‘OG204’는 표준 품종과 대등한 수준의 수량성이 높음과 동시에 출수기가 빠른 조숙성 특성을 나타내었다. 이는 생육 기간을 단축하면서도 수량 감소를 최소화할 수 있어, 향후 국내 이모작 작부체계에 적합한 신품종 육성에 있어 가치 있는 교배 모본으로 평가된다. 결과적으로, 본 연구를 통해 선발된 36개의 계통, 그 중에서도 다중 형질이 우수한 Double Elite 계통들과 출수기가 빠른 OG391, OG204 계통은 향후 국내 환경에 적합한 다수성 및 조숙성 귀리 신품종 육성을 위한 핵심 교배 모본으로 높은 활용 가치를 지닐 것으로 판단된다.
Notes
-
사사
본 연구는 농촌진흥청 국립식량과학원의 연구사업(과제명: 고품질 사료맥류 신품종 개발(4단계), 연구과제번호:PJ017257032026)과 2026년도 농촌진흥청 국립식량과학원 전문연구원 과정 지원사업에 의해 이루어진 결과로 이에 감사드립니다.
보충자료
본문의 Supplementary Tables 1-3은 한국육종학회지 홈페이지에서 확인할 수 있습니다.
Fig. 1.Correlation heatmap of agronomic traits in 481 oat accessions. The heatmap shows pairwise Pearson’s correlation coefficients among agronomic traits of 481 oat accessions. Color scale ranges from -1 (blue, strong negative correlation) to +1 (red, strong positive correlation). Numeric values within cells indicate correlation coefficients. Trait abbreviations: DSS; Degree of seed shattering, PS; Panicle shape, AB; Attitude of branch, GH; Growth habit, LL; Lemma length, TGW; Thousand grain weight, LW; Lemma width, LC; Lemma color, FRFL; Frequency of recurved flag leaf, FLL; Flag leaf length, PD; Panicle density, LSWB; Leaf sheath waxy bloom, PH; Plant height, PL; Panicle length, FLW; Flag leaf width, MD; Maturity date, FHD; First heading date, HD; Heading date. Significance levels: *p<0.05, **p<0.01, ***p<0.001.
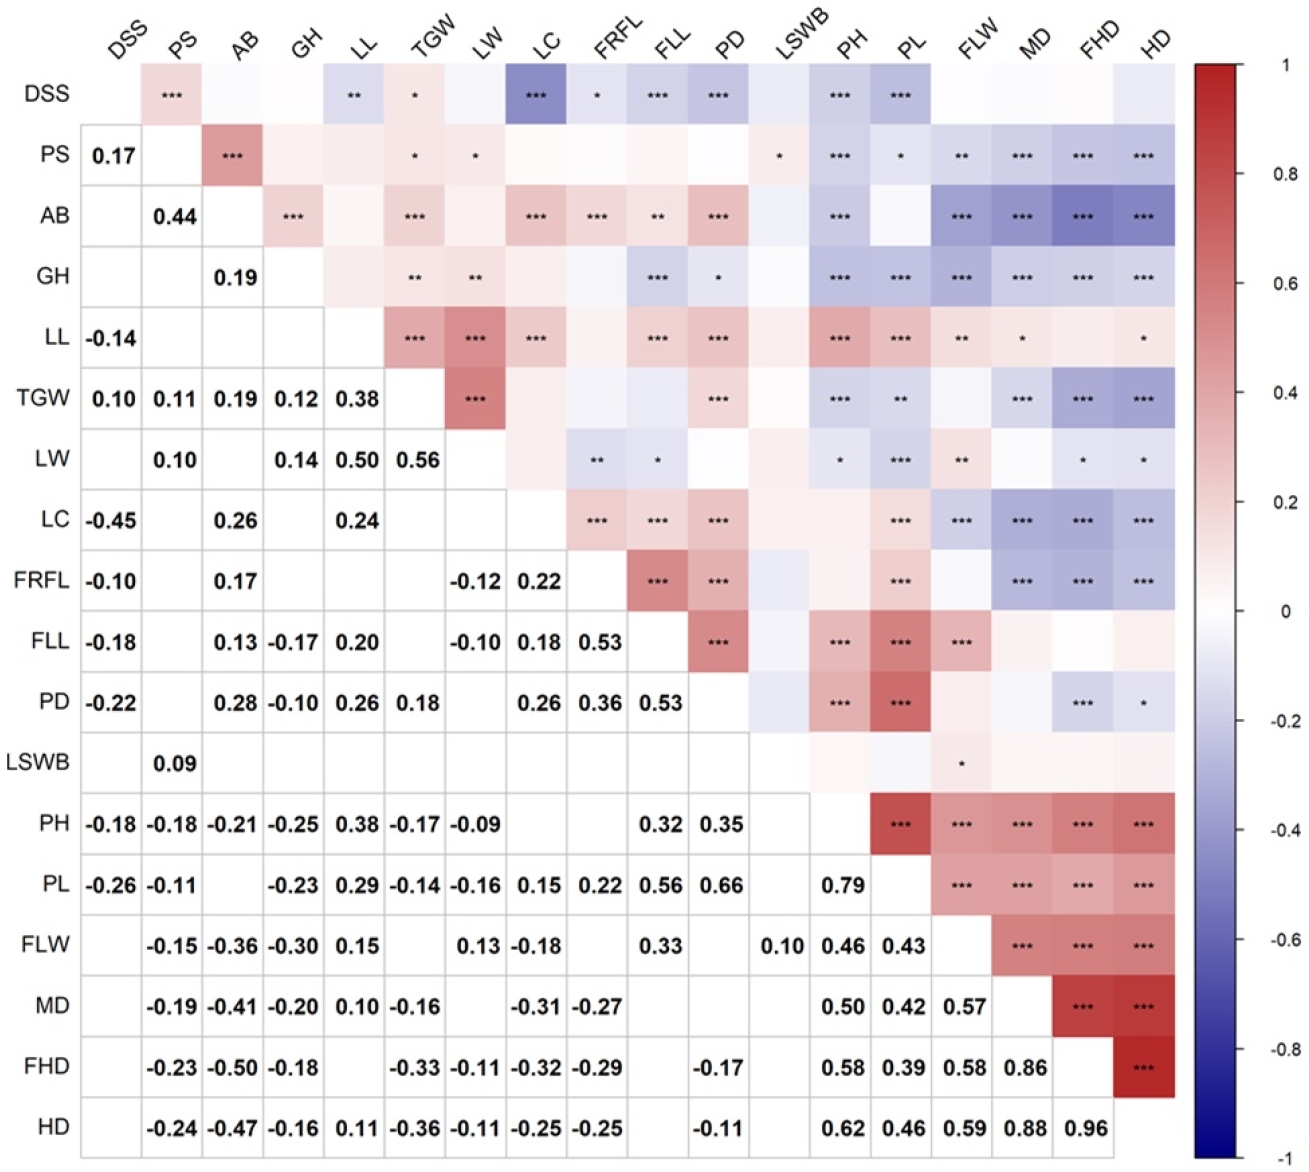
Fig. 2.Correlation analysis of key agronomic traits and selection of elite lines in oat accessions. These scatter plots show the positive correlations between key agronomic traits within the crop population and highlight the selection of elite lines based on specific thresholds. Gray open circles represent individual plants within the entire accessions, and the solid black line indicates the linear regression fit with a 95% confidence interval. The R2 value in the upper left corner of each plot represents the coefficient of determination. The orange diamond (OG001) indicates the standard variety, and the blue circles indicate the elite lines selected under each specific criterion. (a) Relationship between heading date and plant height: Displays a positive correlation (R2=0.39). The blue-shaded area indicates the region satisfying the 95% selection threshold. (b) Relationship between heading date and flag leaf width: Shows a positive correlation (R2=0.35). The blue-shaded area indicates the region satisfying the 95% selection threshold. (c) Relationship between plant height and panicle length: Exhibits the strongest positive correlation (R2=0.62). The blue-shaded area in the upper right highlights the top 3% elite lines (e.g., OG317, OG113, etc.). (d) Relationship between panicle length and flag leaf length: Demonstrates a positive correlation (R2=0.32). The blue-shaded area in the upper right represents the distribution of the top 10% elite lines (e.g., OG318, OG320, etc.).
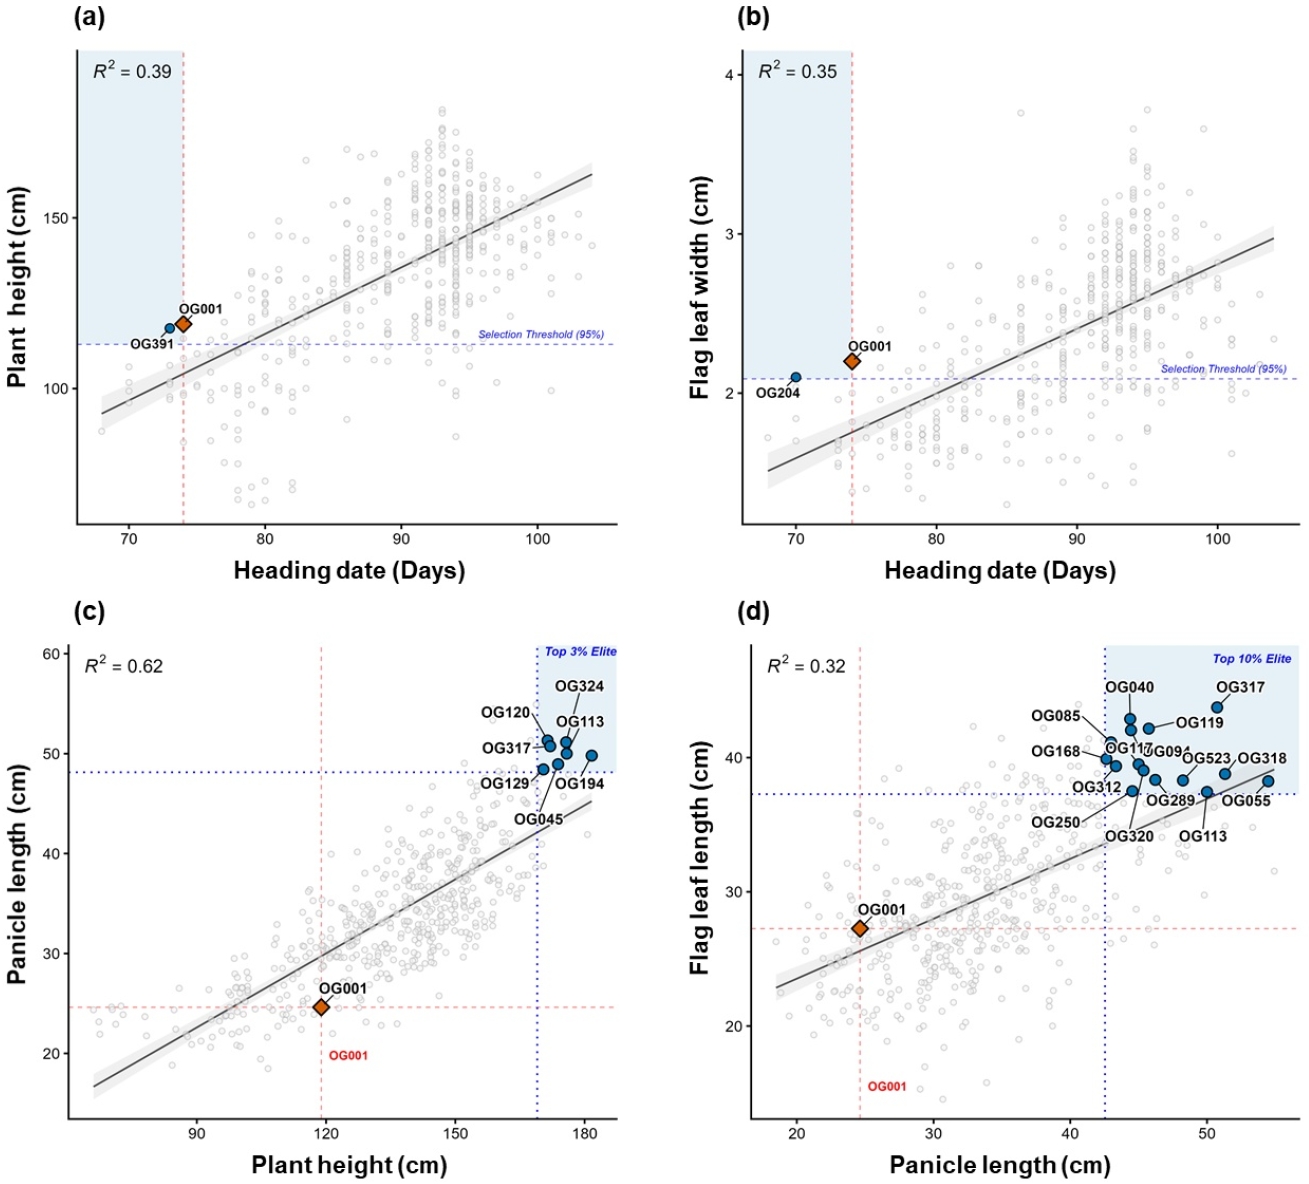
Fig. 3.Principal component analysis (PCA) biplot of oat accessions based on agronomic traits. The first two principal components (PC1 and PC2) account for 58.0% and 20.4% of the total phenotypic variation, respectively. The points represent individual oat accessions categorized into four groups: Normal (light grey point) Standard (orange point, OG001), Single Elite (light blue point), and Double Elite (dark blue point). The arrows indicate the loading vectors of five traits: HD (Heading date), FLW (Flag leaf width), PH (Plant height), PL (Panicle length), and FLL (Flag leaf length).
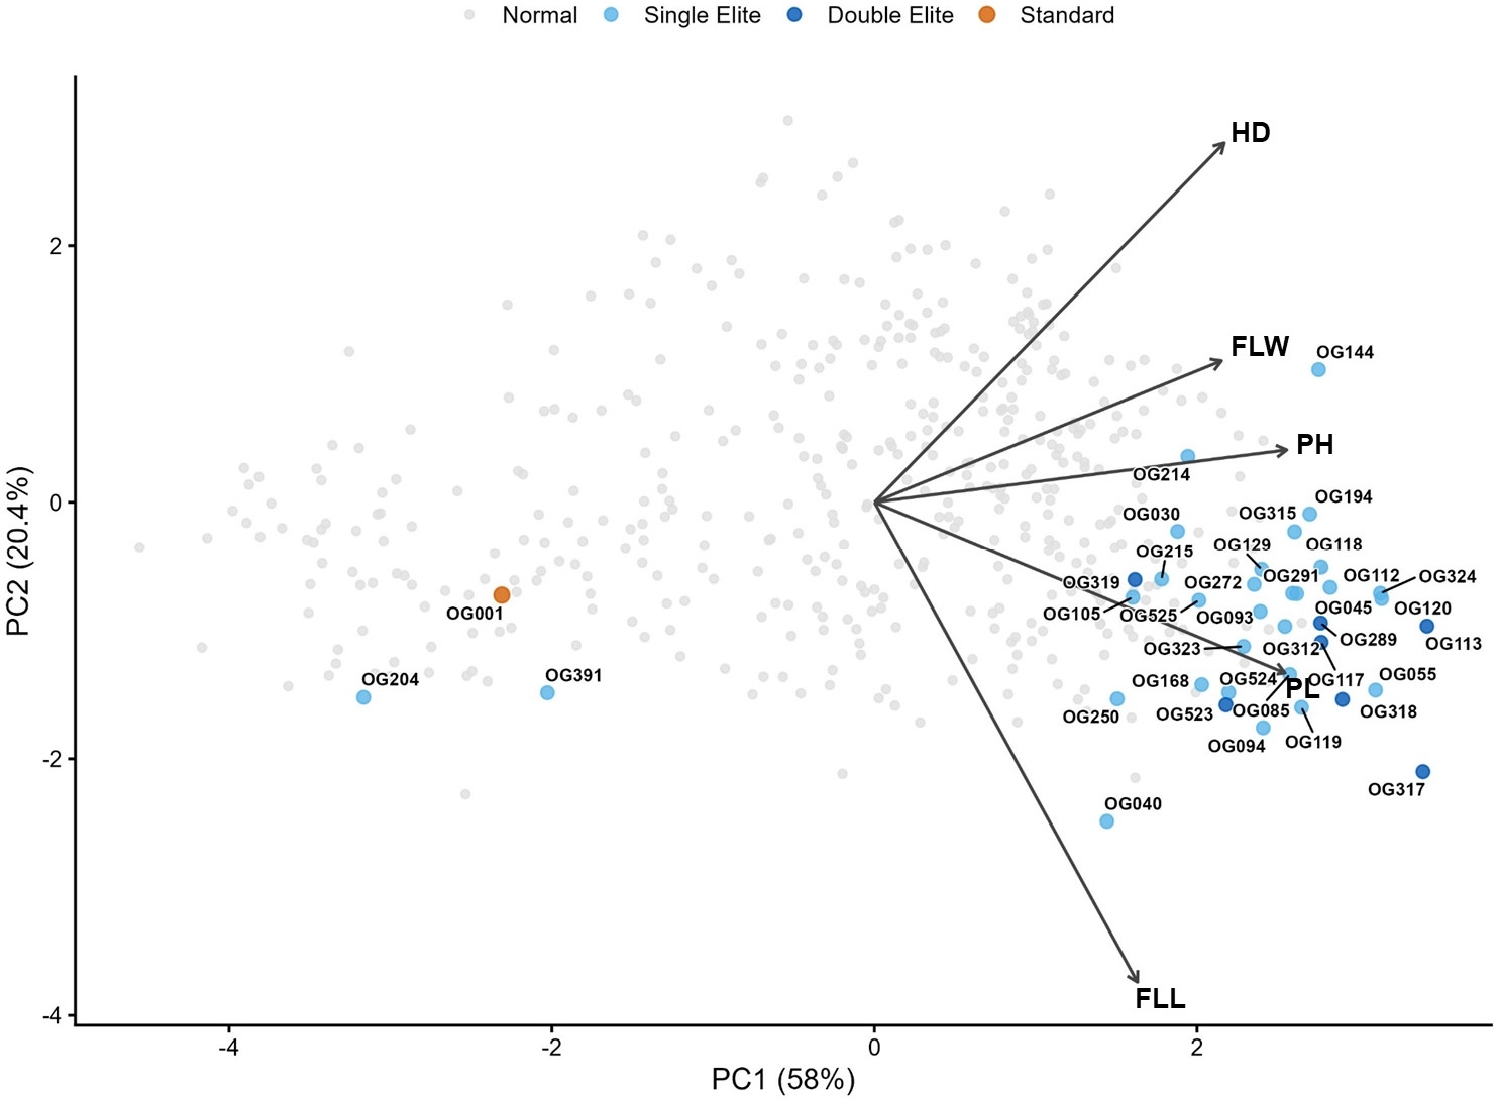
Fig. 4.Euler diagram showing the distribution and overlap of selected elite oat accessions based on three combined trait criteria. A total of 36 elite accessions were categorized into three groups: Biomass (PH and PL), Yield-potential (PL and FLL), and Early-development (HD and FLW). Nineteen accessions and eight accessions belong exclusively to the biomass and Yield-potential groups, respectively (representing Single Elites). Seven accessions overlap between these two groups, meeting both criteria (representing Double Elites). Two accessions are classified in the Early-development group, with no overlap with the other categories. Trait abbreviations: PH; Plant height, PL; Panicle length, FLL; Flag leaf length, FLW; Flag leaf width, HD; Heading date.
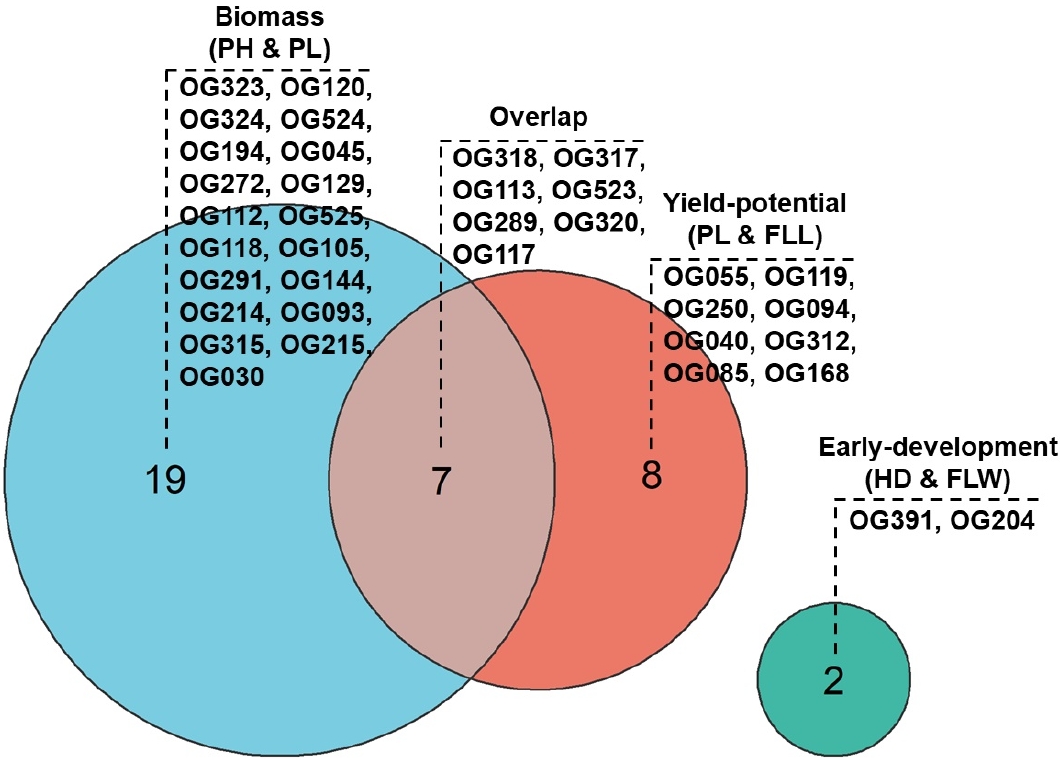
Table 1.Genetic diversity of quantitative agronomic traits in oat accessions.
Table 1.
|
Qualitative traits |
H'z
|
J'y
|
Min.x
|
Max.w
|
Meanv
|
SDu
|
CV (%)t
|
Skewnesss
|
Kurtosisr
|
|
First heading date |
2.041 |
0.886 |
67.00 |
102.00 |
85.17 |
7.41 |
8.70 |
-0.47 |
-0.54 |
|
Heading stage |
1.950 |
0.847 |
68.00 |
104.00 |
89.63 |
7.01 |
7.82 |
-0.78 |
-0.07 |
|
Maturity stage |
1.690 |
0.734 |
104.00 |
138.00 |
119.90 |
5.45 |
4.55 |
-0.49 |
0.26 |
|
Plant height |
2.010 |
0.873 |
66.02 |
181.64 |
134.78 |
21.98 |
16.31 |
-0.66 |
0.20 |
|
Panicle length |
2.036 |
0.884 |
18.48 |
54.92 |
33.66 |
6.91 |
20.54 |
0.38 |
-0.08 |
|
Flag leaf blade length |
2.039 |
0.886 |
14.54 |
43.96 |
29.63 |
5.50 |
18.56 |
0.17 |
-0.42 |
|
Flag leaf blade width |
2.049 |
0.890 |
1.30 |
3.78 |
2.39 |
0.48 |
20.25 |
0.01 |
-0.54 |
|
Panicle density |
1.971 |
0.856 |
2.27 |
6.50 |
4.21 |
0.77 |
18.19 |
0.48 |
0.03 |
|
Thousand grain weight |
1.879 |
0.816 |
9.02 |
40.21 |
22.19 |
4.99 |
22.46 |
0.39 |
0.23 |
|
Lemma length |
1.855 |
0.805 |
0.60 |
2.16 |
1.51 |
0.31 |
20.23 |
-0.81 |
-0.02 |
|
Lemma width |
1.788 |
0.777 |
0.14 |
0.40 |
0.29 |
0.05 |
17.92 |
-0.04 |
-0.16 |
Table 2.Genetic diversity of qualitative agronomic traits in oat accessions.
Table 2.
|
Qualitative traits |
H'z
|
J'y
|
Frequencyx
|
|
1 |
2 |
3 |
4 |
5 |
6 |
7 |
8 |
9 |
|
Growth habit |
1.226 |
0.762 |
0.2 |
- |
36.6
|
- |
36.6
|
- |
21.8 |
- |
4.8 |
|
Frequency of plants with recurved flag leaf |
1.143 |
0.710 |
2.5 |
- |
7.1 |
- |
8.1 |
- |
24.3 |
- |
58.0
|
|
Flag leaf sheath waxy bloom |
1.530 |
0.951 |
21.8 |
- |
29.5
|
- |
24.3 |
- |
16.9 |
- |
7.5 |
|
Panicle shape |
0.559 |
0.403 |
1.9 |
15.0 |
82.3
|
0.8 |
- |
- |
- |
- |
- |
|
Attitude of branches |
1.051 |
0.956 |
20.8 |
- |
45.7
|
- |
33.5 |
- |
- |
- |
- |
|
Degree of seed shattering |
0.210 |
0.191 |
2.3 |
- |
- |
- |
2.1 |
- |
- |
- |
95.6
|
|
Lemma color |
1.270 |
0.709 |
22.0 |
26.4 |
45.5
|
- |
1.5 |
- |
3.5 |
- |
1.1 |
Table 3.Eigenvectors, eigenvalues, and variance contributions of the principal components for major traits in oat accessions.
Table 3.
|
Agronomic traits |
Eigenvectorsz
|
|
PC1 |
PC2 |
PC3 |
PC4 |
PC5 |
|
Plant height |
0.511 |
0.082 |
0.475 |
-0.266 |
-0.660 |
|
Panicle length |
0.509 |
-0.266 |
0.364 |
-0.201 |
0.705 |
|
Flag leaf length |
0.326 |
-0.748 |
-0.311 |
0.426 |
-0.236 |
|
Flag leaf width |
0.430 |
0.221 |
-0.738 |
-0.471 |
0.019 |
|
Heading date |
0.434 |
0.560 |
-0.021 |
0.697 |
0.109 |
|
Eigenvalue |
2.90 |
1.02 |
0.65 |
0.27 |
0.16 |
|
Contribution (%) |
58.0 |
20.4 |
13.0 |
5.5 |
3.2 |
|
Cumulative contribution (%) |
58.0 |
78.4 |
91.4 |
96.8 |
100.0 |
Table 4.Agronomic traits of the selected double and single elite lines compared to the standard variety.
Table 4.
|
Accessions |
Groupz
|
Plant height |
Panicle length |
Flag leaf length |
Flag leaf width |
Heading date |
|
OG001 |
Standard |
118.9±1.2 |
24.6±0.7 |
27.3±2.0 |
2.2±0.1 |
74 |
|
OG318 |
Double elite |
167.5±2.0***
|
51.3±1.8***
|
38.8±1.7**
|
2.6±0 |
92 |
|
OG317 |
Double elite |
172.0±1.7***
|
50.7±2.5***
|
43.7±3.0***
|
2.7±0.1**
|
92 |
|
OG113 |
Double elite |
175.8±5.5***
|
50.0±1.8***
|
37.4±1.7**
|
3.1±0.0***
|
93 |
|
OG523 |
Double elite |
160.0±4.0***
|
48.2±1.0***
|
38.3±1.9**
|
2.3±0.1 |
91 |
|
OG289 |
Double elite |
160.2±1.9***
|
46.2±2.1***
|
38.3±1.9**
|
2.8±0.1***
|
95 |
|
OG320 |
Double elite |
165.8±2.4***
|
45.4±1.1***
|
39.0±2.6**
|
2.6±0.1*
|
91 |
|
OG117 |
Double elite |
166.7±2.4***
|
45.0±1.3***
|
39.5±2.2**
|
2.7±0.1**
|
95 |
|
OG204 |
Single elite |
95.8±1.9***
|
22.2±0.9ns
|
30.5±1.2ns
|
2.1±0.2ns
|
70 |
|
OG391 |
Single elite |
117.6±3.2ns
|
30.6±1.2ns
|
29.7±1.1ns
|
2.0±0.1ns
|
73 |
References
- 1. Brown AHD. 1978. Isozymes, plant population genetic structure and genetic conservation. Theor Appl Genet 52: 145-157.
- 2. Chaudhary D, Gore PG, Wankhede DP, Patil DK, Choudhary SB, Rao AM, Gautam RK, Singh GP, Tripathi K. 2025. Morphological variability and genetic diversity assessment of agronomic traits in cowpea (Vigna unguiculata (L.) Walp.) core collection using multivariate analysis. Genet Resour Crop Evol 72: 6027-6042.
- 3. Curran PJ, West SG, Finch JF. 1996. The robustness of test statistics to nonnormality and specification error in confirmatory factor analysis. Psychol Methods 1: 16-29.
- 4. Daou C, Zhang H. 2012. Oat beta-glucan: Its role in health promotion and prevention of diseases. Comp Rev Food Sci Food Safe 11: 355-365.
- 5. Han OK, Park TI, Park HH, Song TH, Hwang JJ, Baek SB, Kim DW, Kwon YU. 2012. Effect of seeding dates on yield and quality of various oat cultivars for year-around forage production. J Kor Grassl Frage Sci 32: 209-220.
- 6. Hawkes JG. 1991. The importance of genetic resources in plant breeding. Biol J Linn Soc 43: 3-10.
- 7. Kim SJ, Shon HB, Hong SY, Lee JN, Kim KD, Suh JT, Nam JH, Chang DC, Park MW, Kim YH. 2020. Construction of data system on seed morphological traits and functional component in tartary buckwheat germplasms. Korean J Plant Res 33: 446-459.
- 8. Lee SK, Yoon HM, Lee MC, Oh SJ, Rauf M, Hur OS, Ro NY, Yi JY, Hyun DY, Cho GT, Ko HC, Choi YM. 2019. Comparison of the diversity of East Asian oat (Avena sativa L.) genetic resources by origins, considering major nutritional ingredients and agronomic traits. Korean J Breed Sci 51: 9-19.
- 9. Leszczyńska D, Wirkijowska A, Gasiński A, Średnicka-Tober D, Trafiałek J, Kazimierczak R. 2023. Oat and oat processed products—technology, composition, nutritional value, and health. Appl Sci 13: 11267.
- 10. Mathiang EA, Sa KJ, Park H, Jang SJ, Lee JK. 2023. Morphological variation in normal maize landrace accessions collected from South Sudan. Plant Breed Biotech 11: 15-24.
- 11. Park KC, Ku JH, Kim SJ, Kim JJ, Kim SJ. 2026. Global and domestic oat production trends and forage utilization prospects in Korea. J Korean Soc Int Agric 38: 1-9.
- 12. Reddy MT, Begum H, Sunil N, Rao PS, Sivaraj N, Kumar S. 2014. Preliminary characterization and evaluation of landraces of Indian spinach (Basella spp. L.) for agro-economic and quality traits. Plant Breed Biotech 2: 48-63.
- 13. Rural Development Administration (RDA). 2012. Research and analysis standard for agricultural science and technology. 5th ed. RDA Suwon, Korea, pp. 339-348.
- 14. Shannon CE. 1948. A mathematical theory of communication. Bell Syst Tech J 27: 379-423.
- 15. Tosh SM, Bordenave N. 2020. Emerging science on benefits of whole grain oat and barley and their soluble dietary fibers for heart health, glycemic response, and gut microbiota. Nutr Rev 78: 13-20.
- 16. Yu Q, Qian J, Guo Y, Qian H, Yao W, Cheng Y. 2023. Applicable strains, processing techniques and health benefits of fermented oat beverages: A review. Foods 12: 1708.
- 17. Zadoks JC, Chang TT, Konzak CF. 1974. A decimal code for the growth stages of cereals. Weed Res 14: 415-421.
- 18. Zhao Y, Fang J, Gislum R, Zhao B, Zhong Z, Lei Y, Yan D, He R, Chen Y, Zhou Q, Wang H. 2025. Genetic diversity analysis of phenotypic and agronomic traits in oat germplasm resources. Front Plant Sci 16: 1670684.