적요
-
종실 단백질 함량은 밀 가공적성과 제품 품질을 좌우하는 주요 형질 중 하나로, 소비자 선호도와 육종 목표에 직접적인 영향을 미친다. 본 연구에서는 종실 단백질 함량과 관련된 유전 요인을 규명하기 위해, 단백질 함량이 높은 ‘중모2008’과 낮은 ‘조아’를 교배하여 육성한 359개 F7, F8 RIL 집단을 대상으로 QTL 분석을 수행하였다. 35K SNP chip 기반 유전자형 자료와 연차별 표현형 자료를 이용하여 분석한 결과, 종실 단백질 함량과 연관된 QTL 영역 6개를 확인하였다. 이 가운데 3B 염색체에서 두 환경에 공통으로 검출된 QTL (Qgpc-3B)은 종실 단백질 함량 관련 주요 구간일 수 있음을 시사한다.
Qgpc-3B 구간에서 양친 간 다형성이 확인된 2개 마커(AX-95163812, AX-94495360)를 선발하여 유전형별 GPC 차이를 비교한 결과, 중모2008형 유전형을 갖는 계통이 조아형 유전형을 갖는 계통보다 종실 단백질 함량이 높게 나타났다. 또한 단일 마커 분석뿐 아니라 두 마커를 조합한 haplotype 수준에서도 동일한 방향의 분리 양상이 확인되어, 해당 마커들이 집단 내에서 종실 단백질 함량을 구분하는 선발 지표로 활용될 가능성을 시사한다.
본 연구는 밀 종실 단백질 함량 조절에 관여하는 유전적 기반을 제시하고, QTL 분석을 통해 관련 구간을 도출함으로써 후속 유전자 기능 검증 및 분자육종 연구를 위한 기초 자료를 제공한다. 아울러 본 연구에서 제시한 Qgpc-3B 관련 마커는 향후 종실 단백질 함량 개선을 목표로 한 밀 육종에서 선발 효율을 높이는 도구로 활용될 수 있을 것으로 기대된다.
Abstract
Grain protein content (GPC) is a quantitative trait that strongly influences wheat processing quality and end-product performance, but is highly affected by environmental conditions. This study aimed to identify QTLs associated with GPC using Korean wheat resources and assess the usefulness of linked markers for selection. A recombinant inbred line (RIL) population (F7 and F8; n=359) derived from ‘Joongmo2008’ × ‘Joah’ was genotyped with a 35 K SNP array, and QTL mapping was conducted using 4,891 filtered SNPs. Six QTLs were detected, and a major QTL on chromosome 3 B (Qgpc-3B) was consistently identified in both generations. Within the Qgpc-3B interval, lines carrying the ‘Joongmo2008’ alleles at AX-95163812 and AX-94495360 showed higher GPC, and the same trend was confirmed by a two-marker haplotype analysis. The direction of marker effects was also reproduced in a Korean wheat germplasm panel, suggesting that these markers have strong potential as practical selection indices for improving GPC in wheat breeding programs.
-
Key words: wheat, grain protein content, QTL, ICIM, candidate genes
서언
밀(
Triticum aestivum L.)은 전 세계 식량 공급과 가공산업에서 중심적인 역할을 수행하는 주요 작물로써, 제면, 과자 및 제빵산업에서 핵심 원료로 이용되고 있다(
Curtis et al. 2002,
Shiferaw et al. 2013). 밀가루의 가공 적성과 최종 제품 품질은 종실 단백질 함량과 단백질 조성의 영향을 크게 받는 것으로 보고되었으며, 특히 글리아딘과 글루테닌을 포함한 저장 단백질의 양적⋅질적 특성은 제빵성과 제면성 등 용도 적합성을 결정하는 주요 인자로 제시되어왔다(
Alomari et al. 2023,
Kartseva et al. 2023,
Khalid et al. 2023,
Lee et al. 2018,
Shewry 2024,
Siddiqi et al. 2020). 따라서 종실 단백질 함량을 안정적으로 증가시키는 유전적 요인을 규명하고, 이를 육종에서 활용 가능한 마커로 전환하는 연구는 고품질 품종 개발을 위한 핵심 과제다(
Kartseva et al. 2023,
Khalid et al. 2023,
Mukhtar et al. 2025,
Sharma et al. 2020,
Siddiqi et al. 2020). 종실 단백질 함량은 재배 환경과 질소 시비 수준 등 재배 조건의 영향을 받는 형질로 알려져있다(
Alomari et al. 2023,
An et al. 2024,
Asseng et al. 2018,
Mukhtar et al. 2025,
Paina & Gregersen 2023,
Saini et al. 2022,
Shewry 2024). 종실 단백질 함량과 관련된 QTL (Quantitative Trait Loci) 은 다양한 집단과 환경에서 연구되어 왔다(
Heo & Sherman 2013,
Kale et al. 2025,
Rapp et al. 2018). 그러나 많은 QTL은 특정 유전적 배경 또는 특정 환경 조건에서만 검출되거나 효과의 크기와 방향이 환경에 따라 달라지는 사례가 보고되었다(
Kale et al. 2025,
Li et al. 2023,
Paina & Gregersen 2023). 종실 단백질 함량과 연관된 대표 유전자로는 6B 염색체에 위치한 NAM-B1 (No apical meristem-B1; GPC-B1) 이 널리 알려져 있다(
Blanco et al. 1996,
Krishnappa et al. 2017). NAM-B1은 NAC 전사인자 계열(NAM, ATAF, CUC)에 속하는 유전자로서 노화 촉진 및 영양기관 질소 재동원을 통해 종실 단백질 함량 증가에 기여하는 것으로 보고된다(
Alomari et al. 2023,
Kale et al. 2025,
Kartseva et al. 2023,
Li et al. 2023,
Tabbita et al. 2017). 그러나 NAM-B1의 이러한 효과는 조기 노화 촉진에 따른 등숙 기간 단축과 수량 저하가 맞물리는 균형 체제로 알려져있다(
Uauy et al. 2006,
Waters et al. 2009). 따라서 현대 밀 자원에서는 1 bp 삽입되어 기능하지 않는 비기능형과 NAM-B1 유전자가 없는 결실형이 주로 관찰되는 것으로 보고된다(
Shoormij et al. 2023,
Waters et al. 2009). 국내에서도
Cha et al. (2023)에서 NAM-B1 (GPC-B1) 유전자형 분석 및 기능형 선별용 KASP 마커를 제시했으나 기능형 NAM-B1은 국내 품종에서 확인되지 않았다고 보고되었다.
본 연구에서는 종실 단백질 함량 및 관련 형질의 평가와 유전적 분석을 위해, 단백질 함량이 높은 국내 품종 ‘중모2008’과 비교적 낮은 ‘조아’를 교배한 RIL 집단을 구축하엿다. 2024년과 2025년 포장시험에서 확보한 표현형 자료와 35K SNP chip 유전형 자료를 이용하여 QTL mapping을 수행하고, 종실 단백질 함량 변이에 관여하는 영역을 탐색하였다. 또한
Jiang et al. (2021)에서 보고된 KASP 마커(KGPC-4A)의 국내 적용 가능성을 국내 유전적 배경에서 검토하고자 하였다. 마지막으로 반복적으로 검출되는 주요 QTL 구간에 대해서는 기존 유전자 동정 정보를 바탕으로 후보 유전자를 도출하여, 후속 검증 연구의 기반 정보를 제시하고자 하였다.
재료 및 방법
공시 재료 및 재배 방법
본 연구에서는 겨울밀 6배체 품종 ‘중모2008’과 ‘조아’를 이용한 RIL 집단 359계통을 사용하였다. ‘중모2008’은 종실 단백질 함량이 16.4%로 높은 품종이며, 글루테닌 조성은 제빵적성이 우수한 HMW-GS (high molecular weight glutenin subunit) Glu-D1 조성 5+10를 보유한 품종으로 알려져 있다(
Park et al. 2020). 반면 ‘조아’는 종실 단백질 함량이 11.5%로 비교적 낮은 특성을 가지며(
Kang et al. 2024,
Kim 2016), HMW-GS 조성에서는 Glu-D1 2.2+12 대립유전자를 보유한 것으로 알려져 있다(RDA, Plant Variety Protection No. 5845). 양친과 F
7 집단은 2023년 10월부터 2024년 6월까지, F
8 집단은 2024년 10월부터 2025년 6월까지 전라북도 전주 소재 국립식량과학원 포장에서 재배하였다. 2024년 및 2025년에 수확한 종실을 단백질 분석 및 QTL 분석에 사용하였다. 총 359개 계통 중 생육 불량 등으로 표현형 분석에서 제외된 계통은 18개였으며, 나머지 341계통에 대해 종실 단백질 함량을 측정하였다.
재배는 농촌진흥청 표준 재배법(
RDA 2012)에 따라 전작 조건에서 수행하였다. 파종은 매년 10월 25일에 2반복으로 시험구(0.4 m × 3 m)로 하였고, 시비는 질소 9.1 kg/10a를 기준으로 적용하였다. 질소는 파종기 40%, 생육재생기 60%로 분시하였으며, 병해충 및 잡초 방제 등 기타 관리는 표준재배법(
RDA 2012)에 준하였다.
추가로 본 연구에서 도출한 3B 구간 마커의 적용성을 검증하기 위해 국내 밀 유전자원 집단을 검증 집단으로 활용하였다. 국내 밀 유전자원은 2023년 10월부터 2024년 6월까지 RIL 집단과 동일한 시험포장에서 재배하여 2024년 수확 종실을 이용하였다. 수확 종실의 단백질 함량은 본 실험과 동일한 방법으로 측정하여 마커 효과 검증에 사용하였다. 국내 밀 유전자원 집단은 총 573자원으로 국내 밀 품종 49점, 한국 우량 계통 168점, 북한 밀 수집자원 86자원, 재래종 270계통으로 구성되어 있다.
단백질 측정
밀 종자 시료 3 g을 시료용기에 넣어 근적외선 분광분석기(Tango Ⅱ, Bruker, Germany)로 스펙트럼을 획득하였다. 수분 및 단백질 함량은
Yang et al. (2021)의 분석 조건을 참고하여 산출하였으며 시료당 3회 반복 측정하였다. 수분 분석 파장 범위는 9,311.1~4,474.3 nm였고, 단백질 분석에는 9,588.8~8,100.0 nm, 7,644.8~6,518.6 nm, 6,001.7~5,392.3 nm 및 4,960.3~4,489.7 nm 구간을 사용하였다. 정량값은
Kim et al. (2019)에서 구축된 검량선을 스펙트럼에 적용하여 계산하였다.
Genomic DNA는 습윤 여과지를 깔아 배양한 페트리 접시에서 10일간 생육한 어린 잎을 채취하여 추출하였다. 채취한 잎은 액체질소로 즉시 동결한 뒤 미세 분말로 파쇄하였다. DNA는 HigeneTM Genomic DNA prep kit (BioFACT, Republic of Korea)를 사용하여 분리하였다. 추출한 DNA는 NanoDrop 1000 spectrophotometer (Thermo Scientific, Wilmington, USA)로 농도를 확인한 후 -20℃에 보관하여 genotyping 분석에 사용하였다.
Genotyping은 35K SNP iSelect chip array (DNA Link, Republic of Korea; 35,143 SNP)를 이용하여 수행하였다(
Allen et al. 2017). 확보된 SNP 자료는 IWGSC v1.0 기준 유전체에서 염색체 위치 정보가 확인되지 않은 마커(3,271개)를 제외하여(
Wilkinson et al. 2020) 31,926개의 다형성 SNP 마커를 선발하여 분석에 활용하였다(DNAcare, Republic of Korea).
Jiang et al. (2021)에서 종실 단백질 함량과의 연관성이 보고된 KGPC-4A 기반 KASP (Kompetitive allele specific PCR) 마커를 이용하여 ‘중모2008’ × ‘조아’ 교배 유래 RIL 집단(F7 및 F8)에서 마커 적용성을 검증하였다.
Jiang et al. (2021)에서 제시된 KGPC-2B, KGPC-2D, KGPC-4A 마커에 대해 양친(‘중모2008’, ‘조아’)의 유전형을 검정한 결과, KGPC-2B 및 KGPC-2D는 양친 간 대립유전자 분리가 확인되지 않아 분석에서 제외하고 KGPC-4A 만을 적용하였다. KASP primer mix (assay mix)는 FAM-tail 또는 HEX-tail이 결합된 allele-specific forward primer 2종과 common reverse primer 1종을 10 mM Tris 완충액에 FAM forward:HEX forward:common reverse:Tris=12:12:30:46 비율로 혼합하여 제조하였다. 반응은 96-well PCR plate에서 수행하였으며, 총 반응액은 10.14 μL로 조성하였다(2x KASP Master Mix 5.0 μL, genomic DNA 5.0 μL, assay mix 0.14 μL). PCR 증폭은 BIORAD-CFX Opus 96 Real-Time PCR System (Bio-Rad, USA)에서 수행하였고, 반응 조건은 94℃에서 15분간 처리한 후, 94℃ 20초/61℃ 60초를 10회 반복하고, 94℃ 20초/55℃ 60초를 26번 반복하며 증폭한 뒤 12℃에서 유지하였다. 유전형 판정은 반응 종료 후 측정된 FAM/HEX 형광 신호를 기반으로 장비 소프트웨어에서 생성된 FAM-HEX 산점도의 클러스터 분리 결과에 따라 수행하였다. KASP 유전형 간 종실 단백질 함량 차이는 연차별로 두 표본 t-검정(two sample t-test)으로 평가하였다.
양적형질유전자좌 분석 및 통계 분석
Wheat 35K SNP chip data를 이용하여 양적형질유전자좌분석(Quantitative Trait Locus, QTL)에 적합한 마커를 선별한 뒤 QTL 탐지를 수행하였다. 총 35,143개의 마커 중에서 먼저 양친에서 결측(call=‘NN’)이 관찰되는 마커를 제외하여 34,426개를 남겼다. 이후 양친이 모두 동형접합인 마커만 유지하여 33,115개로 축소하였고, 이 중 양친 간 유전자형이 서로 다른 polymorphic 좌위 5,321개를 선발하였다. 다음으로 chromosome 및 physical position 정보가 중복되는 좌위를 제거하여 5,028개로 정리하였으며, chromosome assignment가 없는 unscaffold 마커를 제외한 후 최종적으로 4,891개 loci를 확보하였다. 추가로 전체 359개 RIL 집단을 대상으로 missing rate 10% 및 minor allele freauency (MAF) 10% 기준을 적용하여 마커를 필터링하였다. QTL 분석에 사용된 표현형 값은 각 RIL 계통을 반복구 없이 계통당 1 구획으로 재배하여 얻은 시료를 대상으로 NIR를 3반복 측정한 후, 그 평균값을 사용하였다. QTL 탐지는 QTL ICiMapping v4.2에서 Inclusive Composite Interval Mapping의 additive 모형(ICIM-ADD)을 이용하여 수행하였다(
Meng et al. 2015). 분석 설정은 step 0.1 cM, stepwise regression의 probability 0.001로 설정하였다. QTL 유의성 판정을 위한 LOD 임계값은 QTL ICiMapping에서 permutation test (1,000 permutations, α=0.05)로 산정하였다. Bi-parental RIL 집단의 특성상 population structure 보정은 별도로 하지 않았다. 유전지도 및 염색체 상 마커 분포 시각화는 MG2C와 R을 이용하여 작성하였다(
Chao et al. 2021). 유의한 SNP 마커의 probe 서열을 Ensembl Plants에서 확보한 뒤(Yates et al. 2022), NCBI BLAST를 이용하여 IWGSC RefSeq v2.1 참조유전체에 정렬하여 물리적 위치를 확인하였다(
Altschul et al. 1990,
Altschul et al. 1997). QTL로 정의된 구간 내 후보 유전자 탐색을 위해 URGI JBrowse의 IWGSC RefSeq v2.1 데이터셋에서 IWGSC Annotation v2.1 기준 high-confidence (HC) 유전자를 추출하여 후보 유전자를 탐색했다.
통계분석(분산분석, 상관분석 및 평균 비교)은 R (version 4.4.0)을 이용하여 수행하였다. 분산분석은 실험 설계에 따라 일원/이원 ANOVA로 수행하였고 처리 평균 간 비교는 Tukey의 HSD 사후검정을 적용하였다. 평균 비교가 두 집단 간에 해당하는 경우에는 two sample t-test를 적용하였다. 상관분석은 Pearson 상관계수를 산출하여 수행하였다.
결과 및 고찰
밀 종실 단백질 함량 연차 간 변이 분석
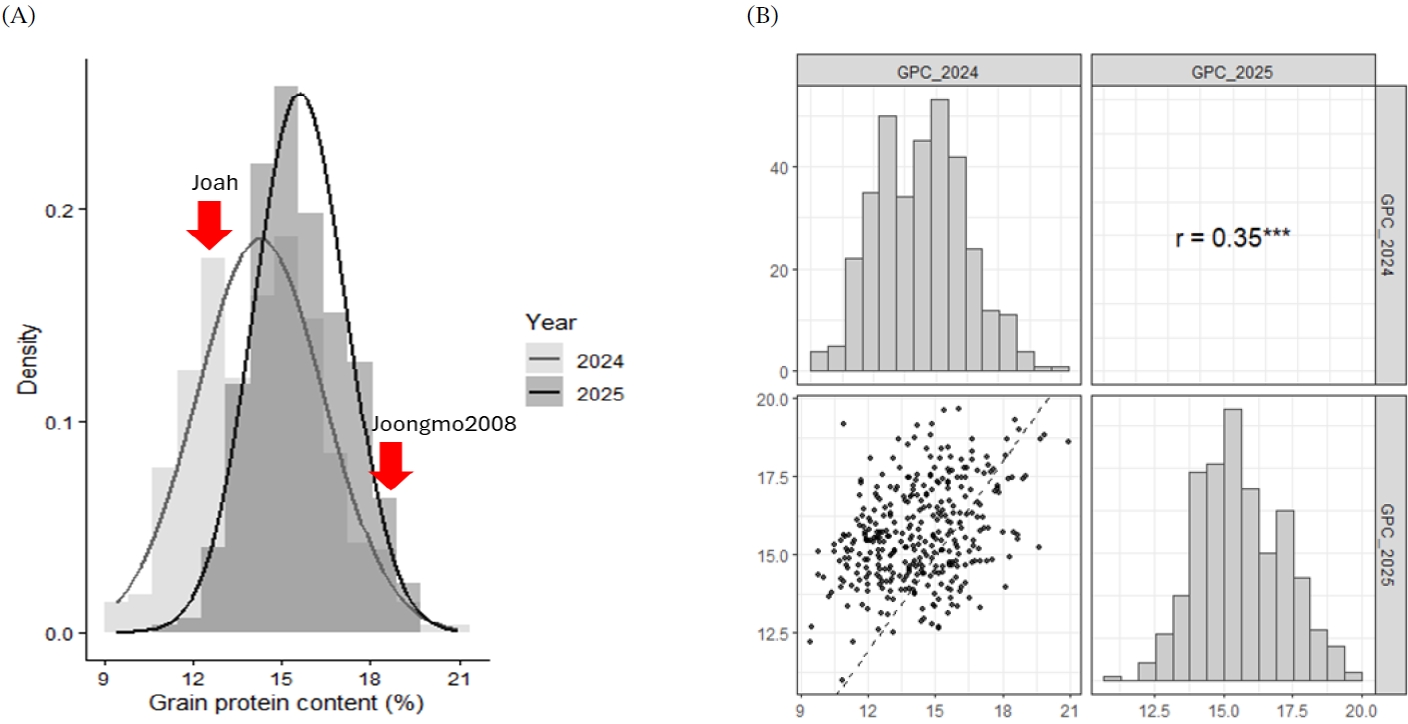
‘중모2008’ × ‘조아’로부터 구축된 RIL 집단을 대상으로 2024년과 2025년 수확된 종실의 단백질 함량 자료를 이용하여 연차간 변이 양상과 분포를 비교하였다(
Fig. 1A). 2개년의 단백질 함량은 모두 정규분포에 가까운 형태를 나타냈다. 종실의 단백질 함량은 2024년은 최소 9.39%, 최대 20.95%로 평균 14.27%이었고, 2025년은 최소 10.98%, 최대 19.68%로 평균 15.62%로 확인되었다(
Fig. 1A). 2024-2025년 연차간 평균의 차이는 1.34% (15.61-14.27%)였고, 범위 폭(최대-최소)은 2024년 11.56% (20.95-9.39%), 2025년 8.70% (19.68-10.98%)으로 나타났다. 표준편차는 2024년 ±2.15, 2025년 ±1.56이었다(
Fig. 1A). ‘중모2008’은 2024년 19.80%, 2025년 18.29%로 나타났다. ‘조아’는 2024년 12.15%, 2025년 14.21%로 나타났다(
Fig. 1A). 연차 간 변화량은 ‘중모2008’에서 1.51% 감소하였고, ‘조아’에서 2.06% 증가하였다. 동일한 계통의 종실 단백질 함량의 연차간 상관계수는 r=0.35***로 확인되었다. 이는 유전적 요인이 일정 부분 유지되는 동시에 연차간 환경에 의한 영향이 크게 작용함을 보여준다(
Fig. 1B). 이러한 특성은 종실 단백질 함량과 같은 양적 형질에서 집단과 환경 조건에 적합한 QTL 분석이 필요함을 시사한다. 또한 도출된 QTL/마커의 실용성을 확보하기 위해서는 독립적인 유전적 배경을 갖는 핵심집단 또는 NIL (Near Isogenic Line) 집단을 이용한 재현성 검증이 또한 필요할 것으로 생각된다.
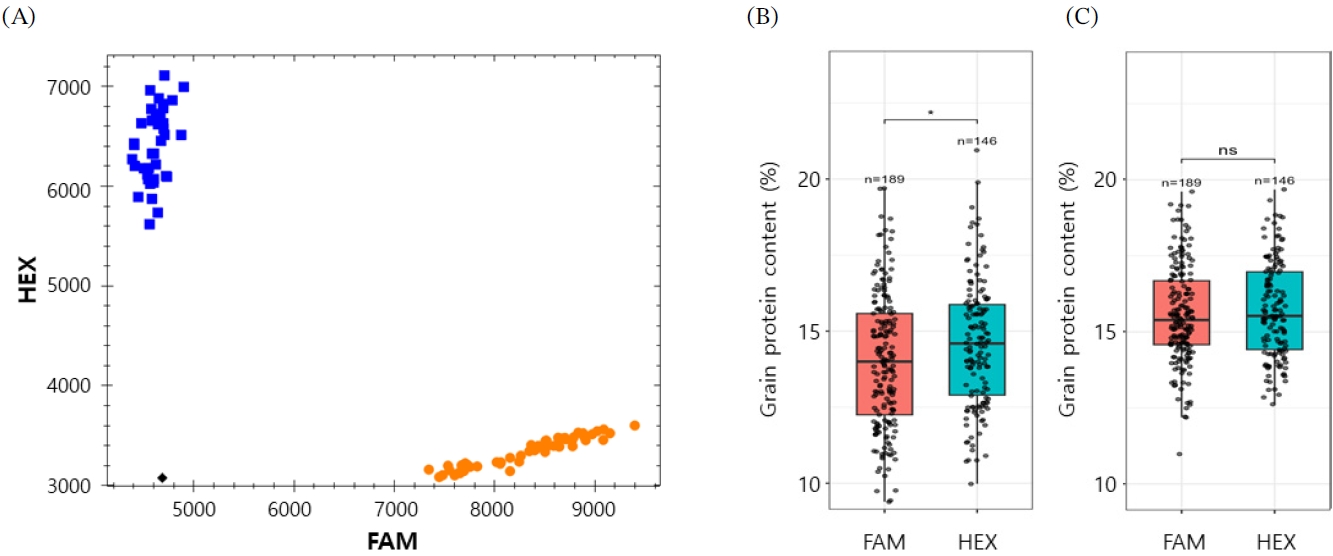
Jiang et al. (2021)에 의해 보고된 KGPC-4A KASP 마커는 국내 RIL 집단을 대립유전자형(FAM_CC/HEX_TT)에 따라 명확하게 분리되었다(
Fig. 2A). CC 대립유전자형을 갖는 계통은 종실의 단백질 함량이 증가되는 것으로 보고되었으나 국내 RIL 집단에서는 종실 단백질 함량과 부의 상관을 나타냈다. 2024년에는 TT 유전형을 갖는 146계통의 평균 종실 단백질 함량은 14.6%로 CC 유전형을 갖는 189계통(14.0%)보다 0.6% 높았다(
p=0.015;
Fig. 2B). 2025년 단백질 함량도 유전형에 따라 동일하였으나, 통계적으로 유의하지 않았다(
p=0.403;
Fig. 2C). 이와 같은 결과는 KGPC-4A 마커는 국내 RIL 집단을 유전형에 따라 분리할 수 있으나, 종실의 단백질 함량 예측을 위한 분자마커의 활용적인 측면에서는 효과가 높지 않음을 나타낸다. KGPC-4A는 중국 밀 육종집단에서 높은 종실 단백질 함량과 연관된 표지로 개발된 바 있어, 본 연구에서 관찰된 상반된 대립유전자 효과는 적용 집단 간 유전적 배경 차이에 기인할 가능성이 있다. 밀의 종실 단백질 함량은 다수의 유전자좌가 관여하는 복합 양적형질이며 환경의 영향을 크게 받는 형질이다(
Paina & Gregersen 2023). 연관분석을 통한 연관불균형(linkage disequilibrium, LD) 역시 집단에 따라 달라질 수 있으므로 (
Laidò et al. 2014) 집단내 계통의 육종 이력이나 유전적 구조가 다를 경우, 동일한 마커라도 효과가 일관되게 재현되지 않을 수 있다. 본 결과는 KGPC-4A가 국내 집단에서 환경 의존적 또는 집단 의존적으로 작용할 가능성을 시사한다. 이에 따라 2024년과 2025년 포장시험에서 측정한 종실 단백질 함량과 35K SNP chip 유전형 자료를 이용하여 종실 단백질 함량 변이에 관여하는 영역을 QTL mapping으로 탐색하였다.
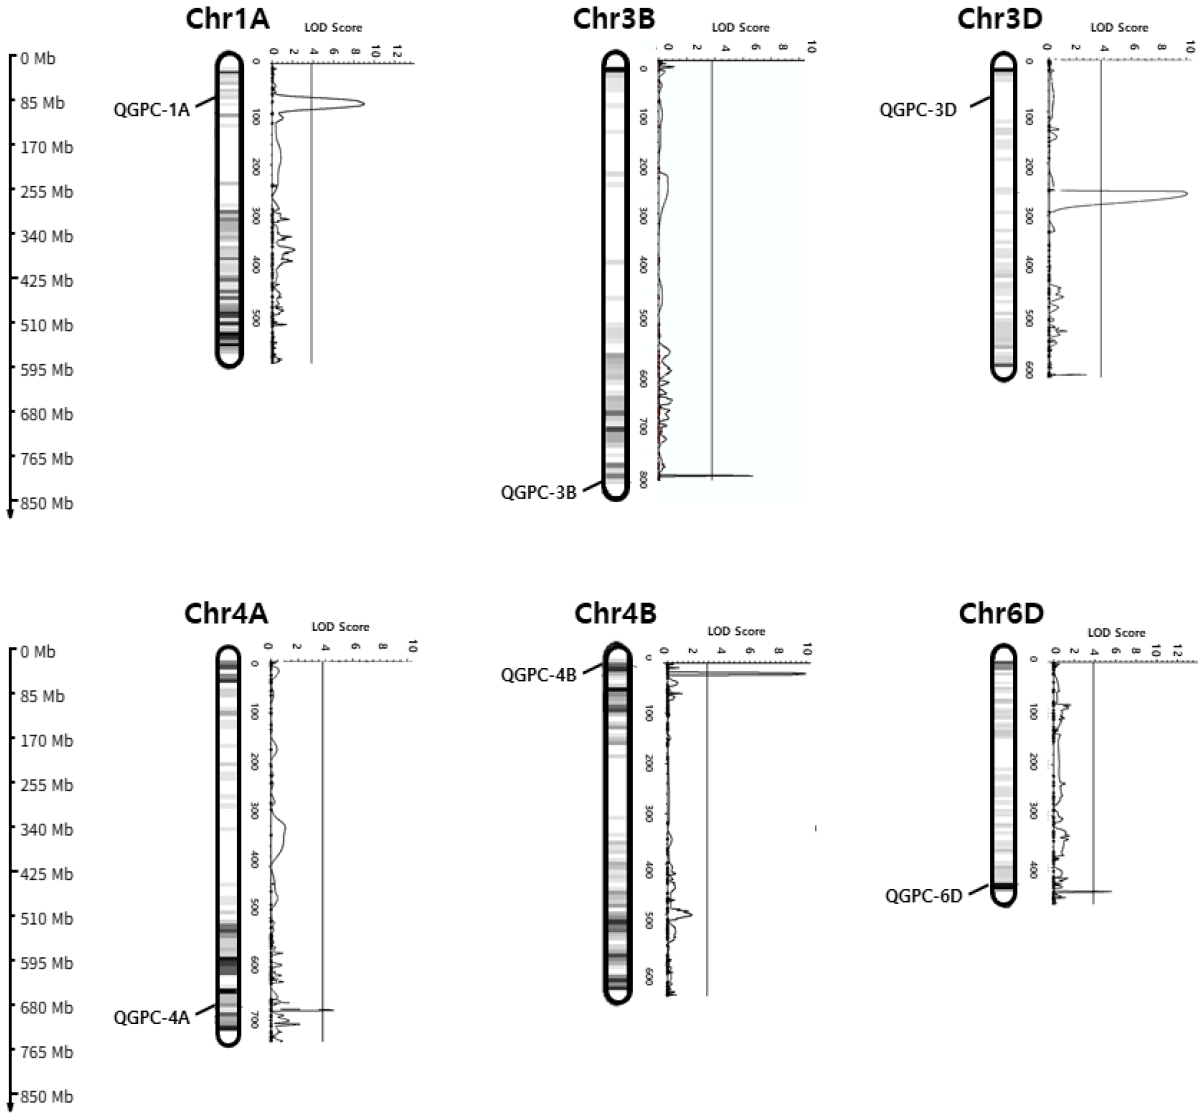
6개 염색체(1A, 3B, 3D, 4A, 4B, 6D)에서 LOD 3.80을 초과하는 QTL이 확인되었다(
Fig. 3). 연차별 분석 결과 2024년은 LOD는 5.32-13.46, PVE는 3.29%-8.76% 범위에서 총 4개의 QTL이 1A, 3B, 4B, 6D에서 확인되었고, 2025년은 LOD는 4.62-10.06, PVE는 3.14%-10.35% 범위에서 3개의 QTL이 3B, 3D, 4A에서 각각 확인되었다. 3B QTL (Qgpc-3B)은 2024년과 2025년 QTL 분석에서 공통으로 확인된 유전자좌(Loci)로서 위치는 두 연차 모두 815.22 Mb로 나타났다(
Table 1). 또한 Qgpc-3B 구간의 flanking marker도 두 연차 모두 AX-95163812로 동일했으며(PVE: 2024년 6.53%, 2025년 8.65%), 연차 변동에도 효과가 반복적으로 검출되는 종실 단백질 함량 관련 QTL 후보로 선별하였다(
Table 1,
Fig. 3). 본 연구에서는 2024년과 2025년의 표현형 자료를 산술 평균하여 분석에 활용하였기 때문에 환경의 영향을 크게 받는 종실의 단백질 함량을 이용한 분석 결과는 연차별 환경 효과 및 유전자형과 환경 상호작용을 충분히 반영하지 못할 수 있다. 특히 본 연구에서 연차 간 상관관계가 r=0.35로 비교적 낮게 나타난 점을 고려하면, 평균값 기반 분석에서 추정된 마커 효과 및 PVE는 안정적인 유전효과를 정밀하게 반영한 값이라기보다 두 연도의 평균적 경향을 나타낸 결과로 해석하는 것이 타당하다. 따라서 특정 연도에서 나타난 반응이 평균화 과정에서 희석되었거나 유전적 효과가 과대 또는 과소평가되었을 가능성을 배제하기 어렵다. 향후에는 BLUP 기반 추정치 또는 다환경 혼합모형을 적용하여 환경효과를 보다 정교하게 분리한 후 추가 검증을 수행할 필요가 있다.
6개 QTLs (Qgpc-1A, Qgpc-3B, Qgpc-3D, Qgpc-4A, Qgpc-4B, Qgpc-6D) 중 Q4B와 Q3B는 종실 단백질 함량에 대한 영향이 가장 큰 주요 마커로 확인되었다(PVE 8.7%, 8.3%). 두 마커 모두에서 ‘중모2008’ 유전형을 보유한 계통이 ‘조아’유전형을 보유한 계통보다 종실 단백질 함량이 0.9%, 0.7% 증가하였다(
Table 2). 또한 ‘중모2008’ 유전형은 나머지 마커(Q1A, Q6D, Q3D)에서도 0.5% 이상 종실 단백질 함량 증가와 관련되었다. 반면 Q4A에서는 효과 방향이 반대로 나타나 ‘조아’ 유전형의 종실 단백질 함량이 0.2% 더 높았다. 두 마커는 생육단계 형질에서도 변화가 함께 발생했다.
‘중모2008’ 유전형은 Q3B에서 1.5일, Q4B에서 1.1일 출수일수가 감소했다. 반대로 Q4A에서는 0.8일 출수일수가 증가하였다. 성숙일수에서는 ‘중모2008’ 유전형이 각각 Q3B에서 0.7일, Q4B에서 1.3일 증가하였다. 총 생육기간에서는 Q3B는 0.7일 감소, Q3D는 0.7일 증가, Q4A도 0.9일 증가하였다. 두 마커간의 상호작용 검정 결과 성숙일수에서는 Q6D × Q3D (PVE 1.3%), 생육일수에서 Q1A × Q3D, Q3B × Q6D, Q6D × Q3D가 각각 2.0%, 1.4%, 1.4%의 설명력을 보였다.
Qgpc-3B의 유전적 효과 분석 및 탐색
종실 단백질 함량은 다수 유전자에 의해 조절되며 환경 영향을 많이 받는 형질이다. 따라서 1B, 2A, 2B, 3A, 3B, 4A, 4B, 5A, 5B, 6A, 6B, 7A, 7B (
Fatiukha et al. 2019,
Gudi et al. 2022,
Guo et al. 2023,
Li et al. 2023,
Saini et al. 2022)처럼 다양한 염색체에서 관련 QTL이 보고되어 왔다. 그러나 개별 QTL의 효과는 재배환경과유전적 배경에 따라 달라질 수 있다. 따라서 육종적 활용을 위해서는 반복적으로 검출되는 QTL을 선별하고, 해당 구간의 marker 및 후보 유전자를 정밀화할 필요가 있다. 본 연구에서는 2024년에 1A, 3B, 4B, 6D에서, 2025년에 3B, 3D, 4A에서 QTL이 검출되었다. 이 중 3B (815.2 Mb) 구간의 QTL (Qgpc-3B)만이 두 연도에서 동일 위치와 동일 marker로 반복 검출되었다. 그러나 본 연구는 단일 지역에서 2개년 시험에 기반하므로, 이를 광범위한 환경 안정성을 지닌 QTL로 해석하기에는 한계가 있다. 따라서 Qgpc-3B는 본 시험 조건에서 반복 검출된 유망 QTL로 보는 것이 적절하며, 향후 G × E 상호작용 분석과 다환경 QTL 모델 분석을 통해 안정성을 추가 검증할 필요가 있다.
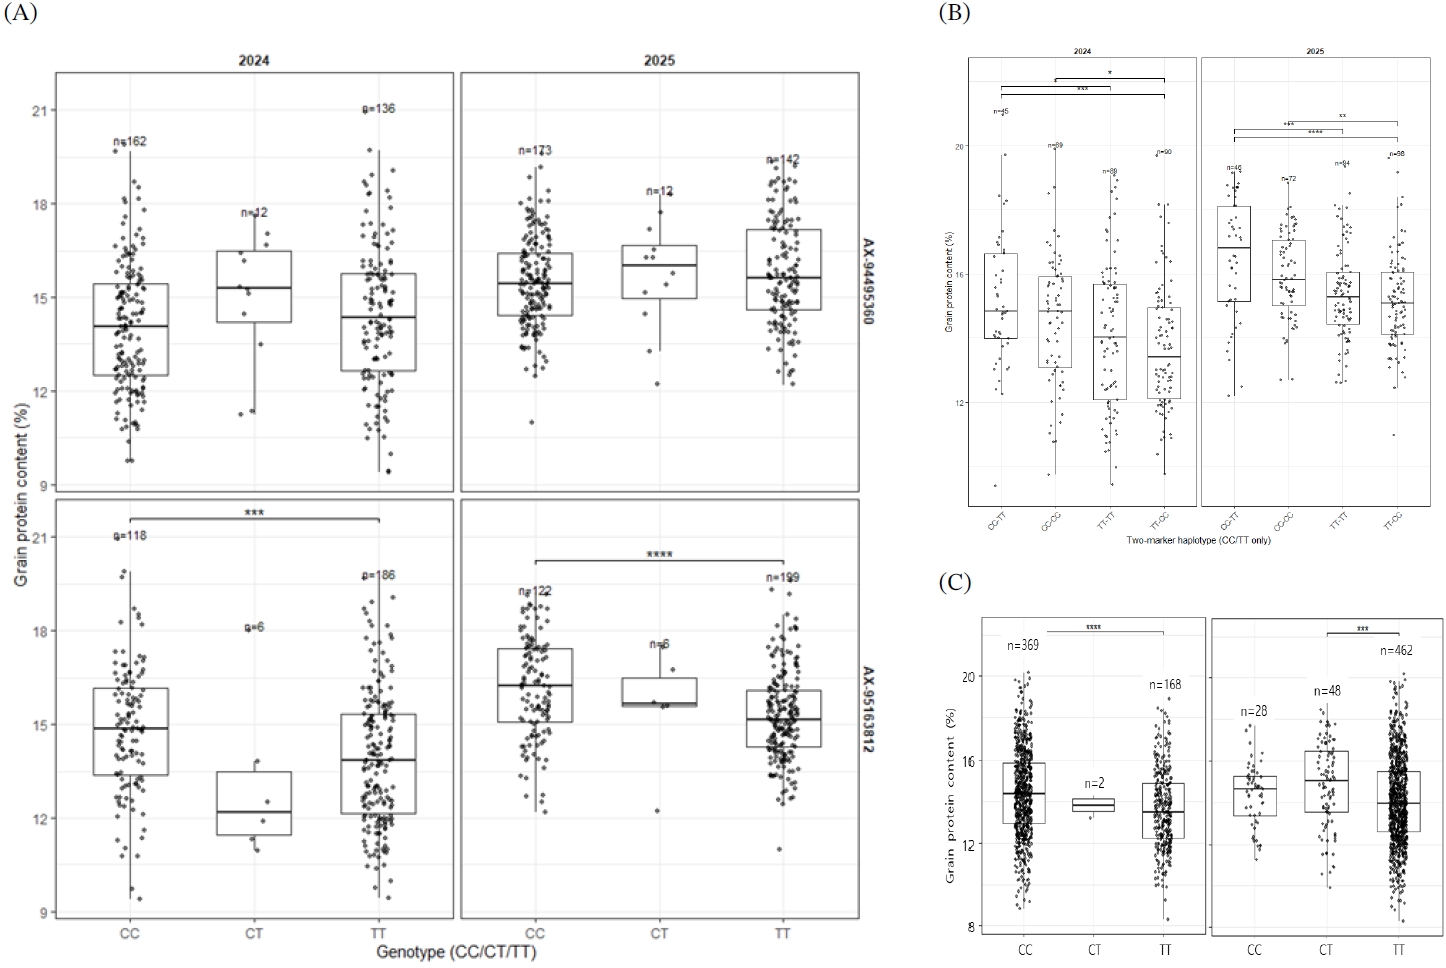
Qgpc-3B 영역 내 마커 구성 및 실제 분리 양상을 확인한 결과 양친 간 다형성이 확인된 마커 중 RIL 집단에서 실제로 분리되는 마커는 2개(AX-95163812, AX-94495360)로 나타났다. RIL 집단에서 마커 유전형별 종실 단백질 함량 평균을 비교한 결과, AX-95163812는 2024년 CC 14.8%, TT 13.9%, 2025년 CC 16.1%, TT 15.0%로 두 연차 모두 CC가 TT보다 높은 방향의 효과를 보였다. 반면 AX-94495360은 2024년 CC 14.1%, TT 14.1%, 2025년 CC 15.5%, TT 15.8%로 효과가 작았다(
Fig. 4A). AX-95163812, AX-94495360 순서로 두 마커를 조합하여 2-marker haplotype을 구성했을 때 CC-TT 조합과 TT-CC 조합 간의 종실 단백질 함량 분리 폭이 2024년에는 1.5%, 2025년에는 1.4%로 단일 마커 대비 분리력이 증가하였다(
Fig. 4B). 또한 양친 유전형을 확인한 결과 AX-95163812에서는 ‘중모2008’이 ‘CC’, 조아가 ‘TT’였고, AX-94495360에서는 ‘중모2008’이 ‘TT’, ‘조아’가 ‘CC’로 확인되었다. 즉 AX-95163812, AX-94495360 순서로 CC-TT는 중모2008형, TT-CC는 조아형 haplotype에 해당한다. 이는 3B 구간에서 양친형 유전형 조합이 집단 내 종실 단백질 함량 형질 분리를 반영하며, 단일 마커보다 haplotype 기반 마커 조합이 선발 효율을 높일 수 있음을 보여준다.
마커의 외부 적용 가능성을 평가하기 위해 국내 유전자원 집단에서 AX-95163812 및 AX-94495360의 유전형별 평균을 비교한 결과, 2024년 자료에서 AX-95163812의 CC 유전형 종실 단백질 함량은 14.4% (n=369)로 TT (n=168)보다 0.7% 높아 결과값과 유의성을 나타냈다(
Fig. 4C). 반면 AX-94495360은 CC 14.4% (n=28), TT 14.1% (n=462)로 차이가 0.3%에 그쳐 국내 집단에서도 분리력이 상대적으로 낮았다. 즉 AX-95163812는 국내 유전자원에서도 종실 단백질 함량 형질 구분에 유효한 후보 선발 마커로서 활용 가능성을 보여준다. 하지만 단일 연차 자료에 기반한 자료이므로 다양한 연차와 집단에서의 반복 검증을 통해 안정성과 적용 범위를 확정할 필요가 있다.
한편 Qgpc-3B 구간 내 유전자 주석 결과 13개 유전자 중 단백질 암호화 유전자는 4개(LOC123072617, LOC123067984, LOC123066800, LOC123072618)였고, 나머지는 tRNA 3개 및 pseudogene 6개로 구성되었다. 단백질 암호화 유전자 중 LOC123072617 과 LOC123067984는 NADH dehydrogenase/ubiquinone oxidoreductase 관련 단백질로 동정되어 에너지 대사 및 동화산물 배분과 연계된 생리 과정에 간접적으로 관여할 가능성이 있다. 또한 LOC123072618은 DNA mismatch repair 단백질 MLH1로 동정되어 발달 과정 또는 환경 스트레스 조건에서 유전체 안정성 유지와 연관될 수 있다. LOC123066800은 기능이 밝혀지지 않아 후속 분석이 필요하다. Qgpc-3B에서 단백질 축적과 직접적으로 연결되는 수송체나 전사인자 유전자가 뚜렷하지 않은 점을 고려하면, 본 QTL 효과가 단백질 코딩 서열의 변이보다는 발현 조절 영역의 변이 혹은 인접 유전자 네트워크(공조절/공발현)에 기반한 간접 효과로 나타날 가능성도 함께 검토할 필요가 있다. 선행연구에서도 종실 단백질 함량과 관련된 QTL이 다양한 염색체에서 보고되었으며, 일부 연구에서는 3B 염색체가 반복적으로 관여하는 경향이 제시되었다.
Muqaddasi et al. (2020)은 유럽 겨울밀 372 자원을 대상으로 종실 단백질 함량, 전분함량, 종실 경도를 분석하여 종실 단백질 함량과 연관된 QTL로 2B, 3B, 6A 등을 보고하였다. 다만 이 연구에서 보고된 3B 연관 신호는 약 731 Mb 부근으로, 본 연구에서 검출된 Qgpc-3B (815.2 Mb)와 물리적 위치가 일치하지 않았다. 또한 QGpc.ipk-2B는 bHLH 전사인자 및 수용체 유사 단백질 인산화 효소를 암호화하는 유전자와 연관될 가능성을 제시되었다. QGpc.ipk-6A는 종실 단백질 함량과 전분함량과 서로 음의 상관관계를 가지며, 등숙기 동안 작동할 수 있는 단백질 인산화 효소 및 subtilisin-like protease 유전자와의 연관성이 논의되었다. 이는 종실 단백질 함량 형질의 변이가 전사조절, 신호전달이나 단백질 재분배와 같은 상위 조절인자일 가능성을 시사한다. 또한
Nigro et al. (2019)은 이탈리아 남부에서 2009년부터 2014년까지 5년 동안 지역x연도 조합으로 구성된 7개 환경에서 듀럼밀 집단을 평가하고 종실 단백질 함량과 연관된 QTL이 2BS, 3AL, 3BL, 4AS, 5BL, 6BL, 7AS, 7BL 등 여러 염색체에 분포한다고 연구되었다. 특히 질소 동화 및 아미노산 대사와 관련된 AlaAT-4A, ASN1-5A, NR-6A와 GS2-2B 후보 유전자들을 제시하여 질소 대사 및 재분배 경로에 할 것으로 보고되었다.
Guo et al. (2023)은 RIL 256 계통과 205자원을 이용하여 등숙 과정에서 개화 후 7, 14, 21, 28일(DAA) 단계별로 종실 단백질 함량과 글루테닌 거대중합체(Glutenin macropolymer content, GMP), 아밀로펙틴, 아밀로스 등 4개 형질의 QTL을 분석하였다. 종실 단백질 함량 관련 QTL은 3B (164 Mb), 2A (264 Mb)가 보고되었다. GMP에서는 QGMP3B (164 Mb) 2017년에 출수 후 7일, 21일과 2018년에 출수 후 7일, 21일에 검출되었으며 단백질, GMP, 아밀로펙틴, 아밀로스 축적하는 과정에서 3B, 4A, 6B, 7A가 관여할 것으로 보고하였다. 선행 연구에서도 3B 염색체가 종실 단백질 함량 관련 QTL이 반복적으로 보고되지만, 본 연구의 Qgpc-3B (815.2 Mb)와는 물리적 위치가 다르다. 따라서 3B 염색체 내에 종실 단백질 함량 형질에 영향을 주는 QTL이 여러 개 존재할 가능성을 시사한다.
본 연구에서 확인된 Qgpc-3B는 연차간 반복 검출과 검증 집단에서 유전형 기반 종실 단백질 함량의 차이(0.7%)를 보여 후보 QTL 영역으로 제시하였다. 하지만 선행 연구의 3B 신호와 물리적 위치가 다르다는 점을 고려할 때 QTL의 효과는 단일 암호화 유전자의 변이로만 설명되기보다는 유전자 조절 네트워크 상호작용도 고려해야한다. 따라서 후속 연구에서는 다양한 연차간, 환경에서의 반복 검증을 할 필요가 있다. 또한 등숙 단계별 발현 분석과 haplotype 기반 fine mapping을 통해 후보 기작 검증이 요구된다. 더불어 종실 단백질 함량은 수량과 음의 상관관계를 가지는 형질이므로 Qgpc-3B의 활용을 위해서는 수량 및 수량구성요소에 대한 추가 검증이 요구된다.
Notes
-
사사
본 연구는 농촌진흥청 국립식량과학원의 공동연구사업 “국산밀 품질안정화를 위한 단백질 및 전분개량”(RS-2025-02214999)의 지원으로 수행되었습니다.
Fig. 1.Year-to Year variation in grain protein content (GPC) and between-year correlation in the Joongmo2008 × Joah RIL population. (A) Density distributions of GPC in 2024 and 2025 with parental values (Joongmo2008 and Joah) indicated by arrows; (B) Scatter plot of line mean GPC values between 2024 and 2025 with marginal histograms; (***, p<0.001).
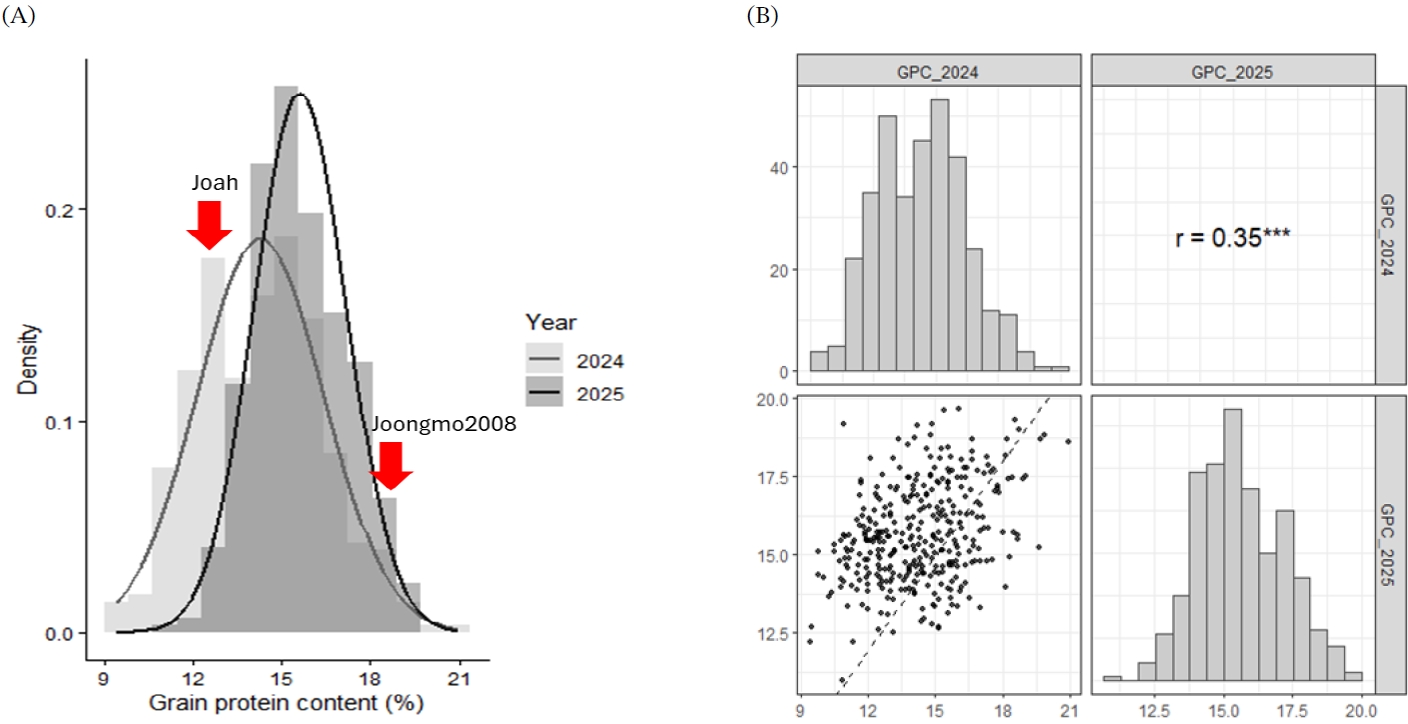
Fig. 2.Performance of the previously reported KGPC-4A KASP marker in the RIL population. (A) KASP cluster plot; (B) Grain protein content by genotype in 2024; (*p<0.01); (C) Grain protein content by genotype in 2025.
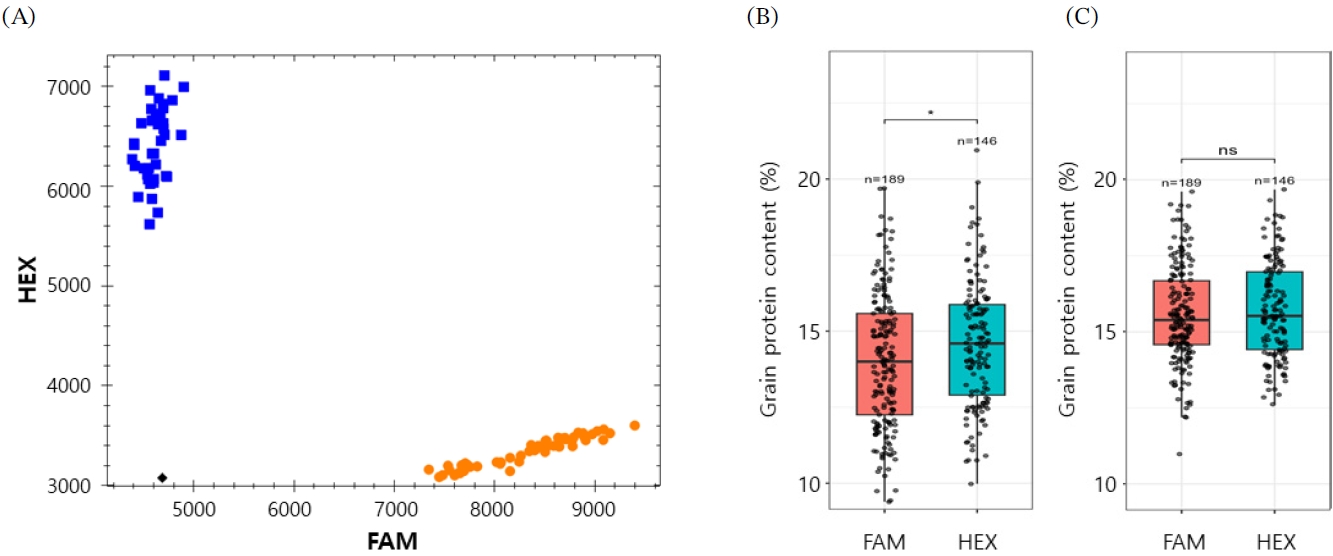
Fig. 3.Chromosomal distribution of QTL for grain protein content (GPC) detected by ICIM-ADD in 2024 and 2025.
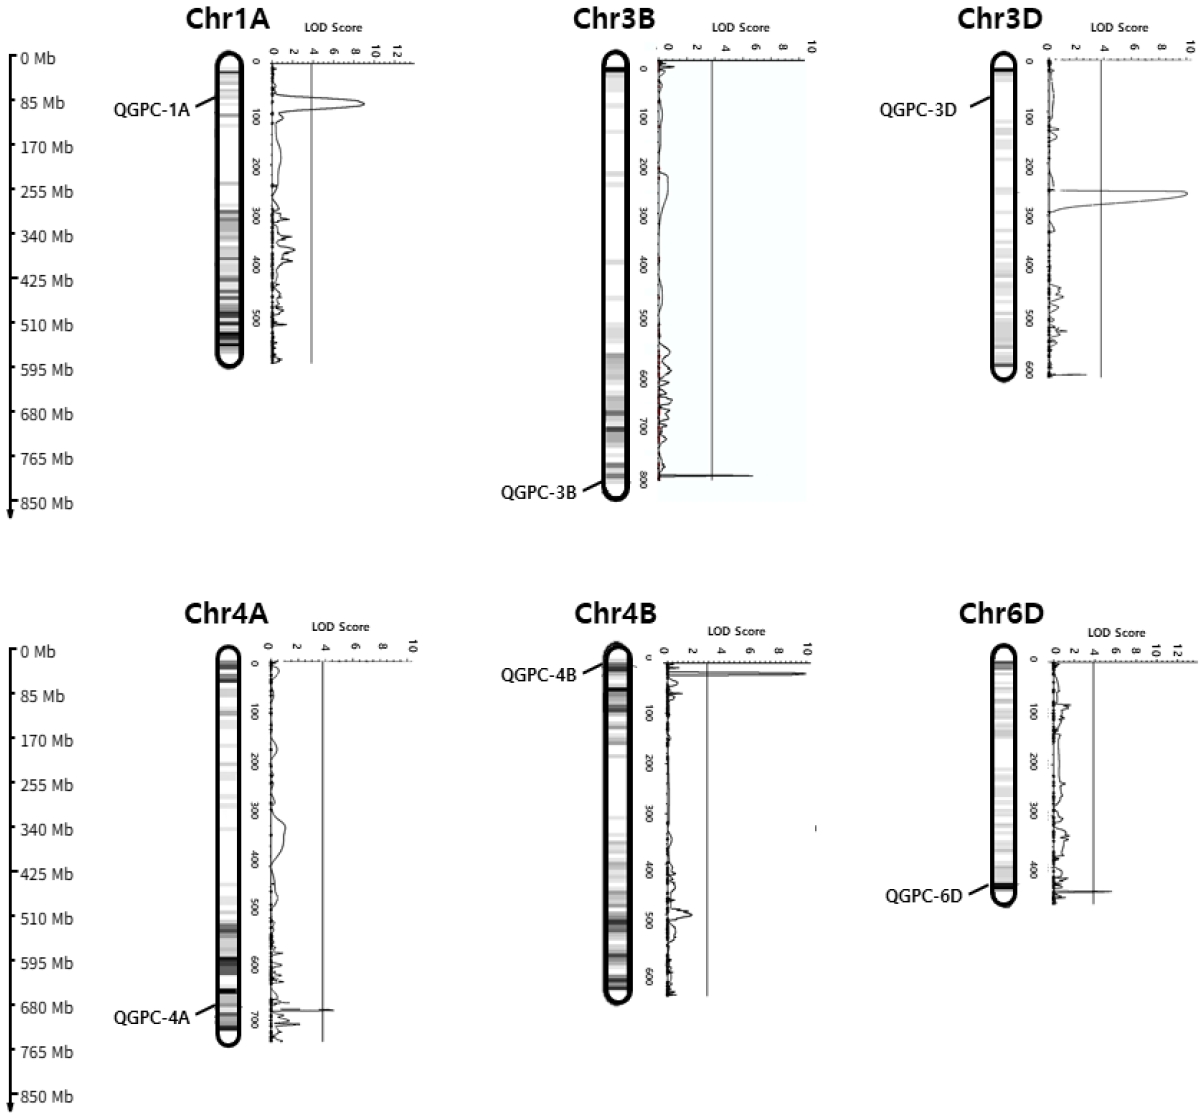
Fig. 4.Grain protein content (GPC) separation by 3B QTL markers and their two-marker haplotypes (2024-2025). (A) NIR-based GPC by genotype (CC/CT/TT) at AX-95163812 and AX-94495360; (B) NIR-based GPC by two-marker haplotypes (AX-95163812; AX-94495360; CC/TT combinations).
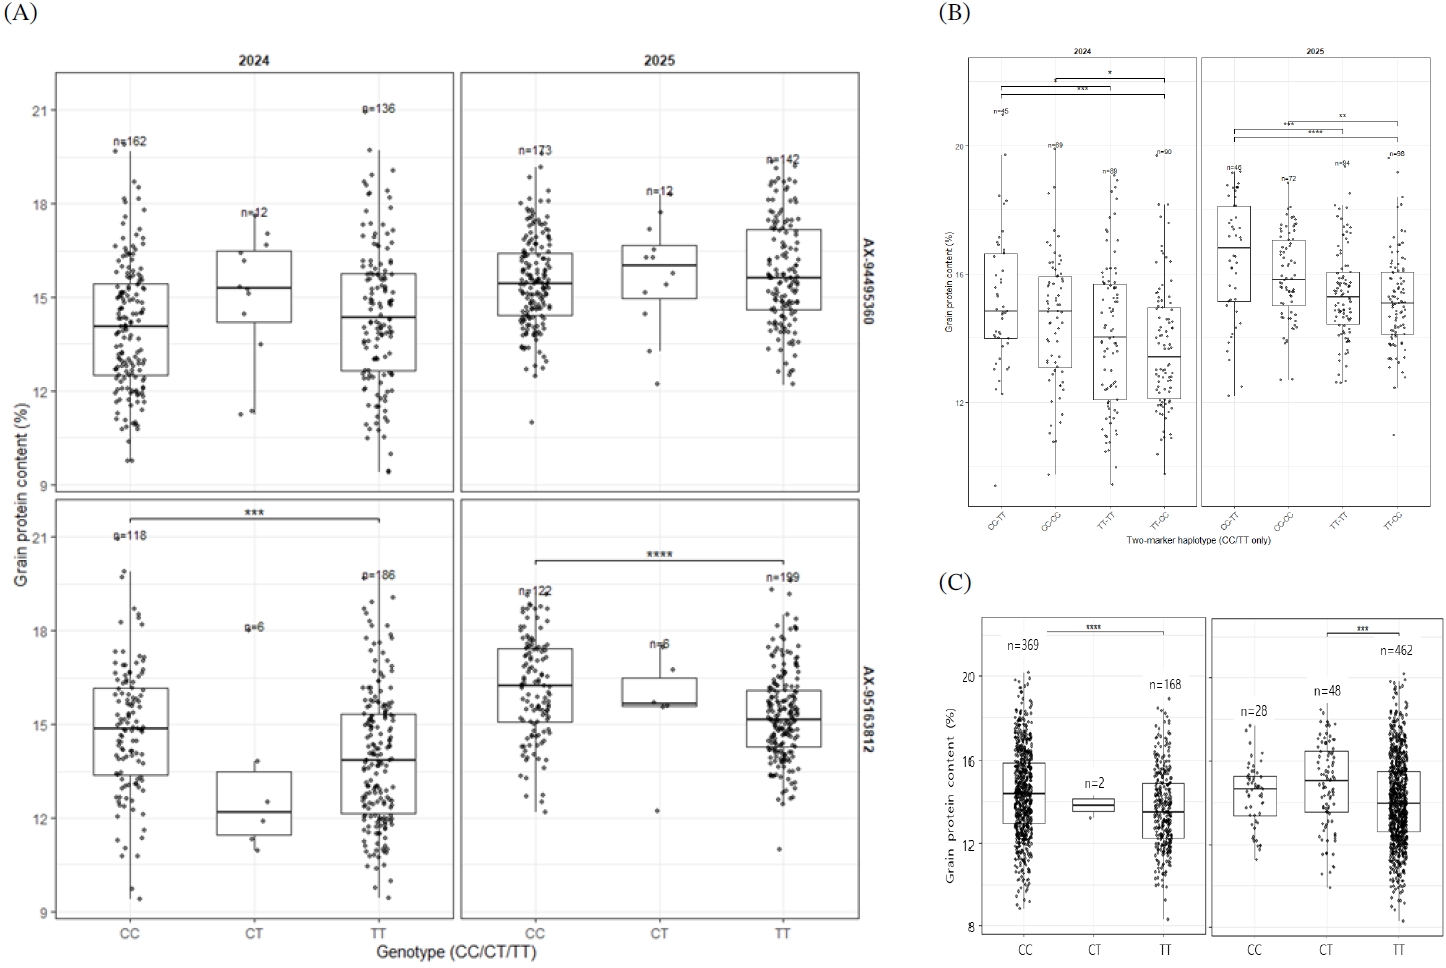
Table 1.QTL for grain protein content detected by ICIM-ADD using NIR measurements in the 2024, 2025 field experiment.
Table 1.
|
Name |
Chromosome |
Envz
|
Position (Mb) |
Left Marker |
Right Marker |
LODy
|
PVEx (%) |
Addw
|
|
Qgpc-1A |
1A |
2024 |
82.2 |
AX-95186684 |
AX-95213979 |
9.012 |
8.4 |
0.758 |
|
Qgpc-3B |
3B |
2024 |
815.2 |
AX-95163812 |
AX-94495360 |
5.317 |
6.53 |
0.681 |
|
Qgpc-4B |
4B |
2024 |
29.7 |
AX-94508980 |
AX-94685504 |
13.462 |
8.76 |
0.802 |
|
Qgpc-6D |
6D |
2024 |
448.5 |
AX-94916148 |
AX-95192727 |
5.605 |
3.29 |
0.476 |
|
Qgpc-3B |
3B |
2025 |
815.2 |
AX-95163812 |
AX-94495360 |
6.719 |
8.653 |
0.548 |
|
Qgpc-3D |
3D |
2025 |
260.2 |
AX-94966048 |
AX-94535928 |
10.056 |
10.353 |
0.587 |
|
Qgpc-4A |
4A |
2025 |
683.4 |
AX-94433908 |
AX-94544185 |
4.616 |
3.143 |
-0.331 |
Table 2.Main and significant two-way interaction effects of six protein-QTL markers on protein content and phenology-related traits (n=287).
Table 2.
|
Traitz
|
Marker |
Main effecty
|
Interaction
|
|
Q1A |
Q3B |
Q4B |
Q6D |
Q3D |
Q4A |
Q1A × Q3D |
Q3B × Q6D |
Q6D × Q3D |
|
Protein (%) |
average |
Joah |
14.6 |
14.7 |
14.6 |
14.7 |
14.6 |
15.2 |
|
|
|
|
Joongmo2008 |
15.5 |
15.6 |
15.3 |
15.4 |
15.5 |
15.0 |
|
|
|
|
blup |
Joah |
14.8 |
14.8 |
14.8 |
14.8 |
14.8 |
15.1 |
|
|
|
|
Joongmo2008 |
15.3 |
15.3 |
15.2 |
15.2 |
15.3 |
15.0 |
|
|
|
|
p-value |
**
|
***
|
***
|
***
|
**
|
*
|
ns |
ns |
ns |
|
PVE (%) |
1.8 |
9.0 |
9.4 |
4.2 |
2.8 |
1.7 |
|
|
|
|
DTH (d) |
average |
Joah |
170.7 |
171.6 |
171.7 |
170.8 |
170.6 |
170.6 |
|
|
|
|
Joongmo2008 |
171.3 |
170.1 |
170.6 |
171.2 |
171.4 |
171.4 |
|
|
|
|
blup |
Joah |
170.8 |
171.4 |
171.5 |
170.8 |
170.8 |
170.7 |
|
|
|
|
Joongmo2008 |
171.2 |
170.4 |
170.8 |
171.2 |
171.3 |
171.3 |
|
|
|
|
p-value |
ns |
***
|
***
|
ns |
ns |
**
|
ns |
ns |
ns |
|
PVE (%) |
|
8.4 |
4.7 |
|
|
2.6 |
|
|
|
|
DTM (d) |
average |
Joah |
43.9 |
43.5 |
43.0 |
43.8 |
43.8 |
43.7 |
|
|
|
|
Joongmo2008 |
43.7 |
44.2 |
44.3 |
43.8 |
43.8 |
43.9 |
|
|
|
|
blup |
Joah |
43.8 |
43.7 |
43.5 |
43.8 |
43.8 |
43.8 |
|
|
|
|
Joongmo2008 |
43.8 |
44.0 |
44.0 |
43.8 |
43.8 |
43.8 |
|
|
|
|
p-value |
ns |
*
|
***
|
ns |
ns |
ns |
ns |
ns |
*
|
|
PVE (%) |
|
1.6 |
4.3 |
|
|
|
|
|
1.3 |
|
GD (d) |
average |
Joah |
214.6 |
215.1 |
214.7 |
214.6 |
214.5 |
214.3 |
|
|
|
|
Joongmo2008 |
215.0 |
214.4 |
214.9 |
215.0 |
215.2 |
215.2 |
|
|
|
|
blup |
Joah |
214.8 |
214.9 |
214.8 |
214.8 |
214.8 |
214.7 |
|
|
|
|
Joongmo2008 |
214.9 |
214.8 |
214.8 |
214.9 |
214.9 |
214.9 |
|
|
|
|
p-value |
ns |
*
|
ns |
ns |
*
|
**
|
*
|
*
|
*
|
|
PVE (%) |
|
1.6 |
|
|
1.5 |
2.4 |
2.0 |
1.4 |
1.4 |
References
- 1. Allen AM, Winfield MO, Burridge AJ, Downie RC, Benbow HR, Barker GL, Wilkinson PA, Coghill J, Waterfall C, Davassi A, Scopes G, Pirani A, Webster T, Brew F, Bloor C, Griffiths S, Bentley AR, Alda M, Jack P, Phillips AL, Edwards KJ. 2017. Characterization of a Wheat Breeders' Array suitable for high-throughput SNP genotyping of global accessions of hexaploid bread wheat (Triticum aestivum). Plant Biotech J 15: 390-401.
- 2. Alomari D, Schierenbeck M, Alqudah A, Alqahtani M, Wagner S, Rolletschek H, Borisjuk L, Röder M. 2023. Wheat grains as a sustainable source of protein for health. Nutrients 15: 4398.
- 3. Altschul SF, Gish W, Miller W, Myers EW, Lipman DJ. 1990. Basic local alignment search tool. J Mol Biol 215: 403-410.
- 4. Altschul SF, Madden TL, Schaffer AA, Zhang J, Zhang Z, Miller W, Lipman DJ. 1997. Gapped BLAST and PSI-BLAST: A new generation of protein database search programs. Nucleic Acids Res 25: 3389-3402.
- 5. An H, Han J, He Q, Zhu Y, Wu P, Wang Y, Gao Z, Du T, Xue J. 2024. Influence of nitrogen application rate on wheat grain protein content and composition in China: A meta-analysis. Agronomy 14: 1164.
- 6. Asseng S, Martre P, Maiorano A, Rötter R, O'Leary G, Fitzgerald G, Girousse C, Motzo R, Giunta F, Babar M, Reynolds M, Kheir A, Thorburn P, Waha K, Ruane A, Aggarwal P, Ahmed M, Balkovič J, Basso B, Biernath C, Bindi M, Cammarano D, Challinor A, De Sanctis G, Dumont B, Rezaei E, Fereres E, Ferrise R, García-Vila M, Gayler S, Gao Y, Horan H, Hoogenboom G, Izaurralde R, Jabloun M, Jones C, Kassie B, Kersebaum K, Klein C, Koehler A, Liu B, Minoli S, Martin M, Müller C, Kumar N, Nendel C, Olesen J, Palosuo T, Porter J, Priesack E, Ripoche D, Semenov M, Stöckle C, Stratonovitch P, Streck T, Supit I, Tao F, Van Der Velde M, Wallach D, Wang E, Webber H, Wolf J, Xiao L, Zhang Z, Zhao Z, Zhu Y, Ewert F. 2018. Climate change impact and adaptation for wheat protein. Global Change Bio 25: 155-173.
- 7. Blanco A, Giovanni C, Laddomada B, Sciancalepore A, Simeone R, Devos K, Gale M. 1996. Quantitative trait loci influencing grain protein content in tetraploid wheats. Plant Breed 115: 310-316.
- 8. Cha JK, Park H, Kwon Y, Lee SM, Oh KW, Lee JH. 2023. Genotyping the high protein content gene NAM-B1 in wheat (Triticum aestivum L.) and the development of a KASP marker to identify a functional haplotype. Agronomy 13: 1977.
- 9. Chao J, Li Z, Sun Y, Aluko OO, Wu X, Wang Q, Liu G. 2021. MG2C: A user-friendly online tool for drawing genetic maps. Mol Horticulture 1: 16.
- 10. In: Curtis BC, Rajaram S, Gómez Macpherson H. (Eds). 2002. Bread wheat: Improvement and production (FAO Plant Production and Protection Series No. 30). Food and Agriculture Organization of the United Nations.
- 11. Fatiukha A, Filler N, Lupo I, Lidzbarsky G, Klymiuk V, Korol A, Pozniak C, Fahima T, Krugman T. 2019. Grain protein content and thousand kernel weight QTLs identified in a durum × wild emmer wheat mapping population tested in five environments. Theor and Appl Genet 133: 119-131.
- 12. Gudi S, Saini D, Singh G, Halladakeri P, Kumar P, Shamshad M, Tanin M, Singh S, Sharma A. 2022. Unravelling consensus genomic regions associated with quality traits in wheat using meta-analysis of quantitative trait loci. Planta 255: 115.
- 13. Guo Y, Wang G, Guo X, Chi S, Yu H, Jin K, Huang H, Wang D, Wu C, Tian J, Chen J, Bao Y, Zhang W, Deng Z. 2023. Genetic dissection of protein and starch during wheat grain development using QTL mapping and GWAS. Fron in Plant Sci 14: 1189887.
- 14. Heo H, Sherman J. 2013. Identification of QTL for grain protein content and grain hardness from winter wheat genetic improvement of spring wheat. Plant Breed Biotech 1: 347-353.
- 15. Jiang P, Zhang P, Wu L, He Y, Li C, Ma H, Zhang X. 2021. Linkage and association mapping and Kompetitive allele-specific PCR marker development for improving grain protein content in wheat. Theor Appl Genet 134: 3563-3575.
- 16. Kale S, Paina C, Füchtbauer W, Bjarup P, Sarup P, Schatz-Jakobsen J, Orabi J, Borum F, Jahoor A, Brinch-Pedersen H. 2025. An introgression from Triticum timopheevii reduces grain protein content in winter wheat populations. The Plant Genome 18: e70090. https://doi.org/10.1002/tpg2.70090
- 17. Kang H, Park HM, Lee SG, Kim EH, Imran M, Choi H, Kim MJ, Oh S. 2024. Current trends in wheat breeding strategies for developing domestic wheat cultivars in Korea. Korean J Breed Sci 56: 491-505.
- 18. Kartseva T, Alqudah A, Aleksandrov V, Alomari D, Doneva D, Arif M, Börner A, Misheva S. 2023. Nutritional genomic approach for improving grain protein content in wheat. Foods 12: 1399.
- 19. Khalid A, Hameed A, Tahir M. 2023. Wheat quality: A review on chemical composition, nutritional attributes, grain anatomy, types, classification, and function of seed storage proteins in bread making quality. Front Nutr 10: 1053196.
- 20. Kim J, Lee K, Oh M, Park H. 2019. Evaluation of feed values for whole crop rice using near infrared reflectance spectroscopy. J Korean Soc Grass1 Forage Sci 39: 292-297.
- 21. Kim S. 2016. Joa-Mil: Wheat for cakes with strong resistance to pre-harvest sprouting. National Institute of Crop Science, https://www.nics.go.kr/bbs/view.do?m=100000126&bbsId=research&bbsSn=205958
- 22. Krishnappa G, Singh A, Chaudhary S, Ahlawat A, Singh S, Shukla R, Jaiswal J, Singh G, Solanki I. 2017. Molecular mapping of the grain iron and zinc concentration, protein content and thousand kernel weight in wheat (Triticum aestivum L.). PLoS ONE 12: e0174972.
- 23. Laidò G, Marone D, Russo MA, Colecchia S, Mastrangelo A, Vita P, Papa R. 2014. Linkage disequilibrium and genome-wide association mapping in tetraploid wheat (Triticum turgidum L.). Plos One 9: e95211.
- 24. Lee YG, Choi SC, Kang Y, Kang CS, Kim C. 2018. Genomics approach to identify the cause of the missing Omega-5 gliadin protein in O-free wheat. Plant Breed Biotech 6: 413-425.
- 25. Leonova I, Kiseleva A, Berezhnaya A, Stasyuk A, Likhenko I, & Salina E. 2022. Identification of QTLs for grain protein content in russian spring wheat varieties. Plants (Basel) 11: 437.
- 26. Li N, Miao Y, Ma J, Zhang P, Chen T, Liu Y, Che Z, Shahinnia F, Yang D. 2023. Consensus genomic regions for grain quality traits in wheat revealed by Meta-QTL analysis and in silico transcriptome integration. The Plant Genome 16: e20336.
- 27. Nigro D, Gadaleta A, Mangini G, Colasuonno P, Marcotuli I, Giancaspro A, Giove SL, Simeone R, Blanco A. 2019. Candidate genes and genome-wide association study of grain protein content and protein deviation in durum wheat. Planta 249: 1157-1175.
- 28. Meng L, Li H, Zhang L, Wang J. 2015. QTL IciMapping: Integrated software for genetic linkage map construction and quantitative trait locus mapping in biparental populations. Crop J 3: 269-283.
- 29. Mukhtar T, Jabeen A, Hussain S, Siddiqi R, Wani S, Mahendru-Singh A, Amin T, Amin Q, Bhat M. 2025. Variability in grain, flour, functional properties and protein profiling in newly developed wheat genotypes grown in temperate climate of Western Himalayas. Front Nutr 12: 1604775.
- 30. Muqaddasi Q, Brassac J, Ebmeyer E, Kollers S, Korzun V, Argillier O, Stiewe G, Plieske J, Ganal M, Röder M. 2020. Prospects of GWAS and predictive breeding for European winter wheat’s grain protein content, grain starch content, and grain hardness. Sci Rep 10: 12541.
- 31. Paina C, Gregersen P. 2023. Recent advances in the genetics underlying wheat grain protein content and grain protein deviation in hexaploid wheat. Plant biology (Stuttg) 25: 661-670.
- 32. Park JH, Kang C, Kim KM, Yang J, Son JH, Choi C, Jung H, Son JY, Park TI, Kim KH. 2020. Characteristics of sourdough breads baked using Korean bread wheats. Korean J Breed Sci 52: 408-418.
- 33. Rapp M, Lein V, Lacoudre F, Lafferty J, Müller E, Vida G, Bozhanova V, Ibraliu A, Thorwarth P, Piepho H, Leiser W, Würschum T, Longin C. 2018. Simultaneous improvement of grain yield and protein content in durum wheat by different phenotypic indices and genomic selection. Theor Appl Genet 131: 1315-1329.
- 34. Rathan ND, Krishna H, Ellur R, Sehgal D, Govindan V, Ahlawat A, Krishnappa G, Jaiswal J, Singh J, Sv S, Ambati D, Singh S, Bajpai K, Mahendru-Singh A. 2022. Genome-wide association study identifies loci and candidate genes for grain micronutrients and quality traits in wheat (Triticum aestivum L.). Sci Rep 12: 7037. https://doi.org/10.1038/s41598-022-10618-w
- 35. RDA. 2012. Standard of research and analysis for agricultural technology. pp. 339-365.
- 36. Rural Development Administration (RDA). Wheat cultivar ‘Joah’. Plant Variety Protection No. 5845. Rural Development Administration, Republic of Korea.
- 37. Saini P, Sheikh I, Saini D, Mir R, Dhaliwal H, Tyagi V. 2022. Consensus genomic regions associated with grain protein content in hexaploid and tetraploid wheat. Front Genet 13: 1021180. https://doi.org/10.3389/fgene.2022.1021180
- 38. Sandhu K, Mihalyov P, Lewien M, Pumphrey M, Carter A. 2021. Genomic selection and genome-wide association studies for grain protein content stability in a nested association mapping population of wheat. Agronomy https://doi.org/10.3390/agronomy11122528
- 39. Sharma A, Garg S, Vyas P, Dhaliwal H. 2020. Effect of wheat grain protein composition on end-use quality. J Food Sci Tech 57: 2771-2785.
- 40. Shewry P. 2024. Can we increase the use of wheat and other cereals as sources of protein? J of Cereal Sci 117: 103889. https://doi.org/10.1016/j.jcs.2024.103899
- 41. Shiferaw B, Smale M, Braun HJ, Duveiller E, Reynolds M, Muricho G. 2013. Crops that feed the world 10. Past successes and future challenges to the role played by wheat in global food security. Food Sec 5: 291-317.
- 42. Shoormij F, Mirlohi A, Chan-Rodriguez D, Bolibok-Brągoszewska H, Saeidi G. 2023. Characterization of 14 Triticum species for the NAM-B1 gene and its associated traits. PLOS ONE 18: e0287798. https://doi.org/10.1317/journal.pone.0287798
- 43. Siddiqi R, Singh T, Rani M, Sogi D, Bhat M. 2020. Diversity in grain, flour, amino acid composition, protein profiling, and proportion of total flour proteins of different wheat cultivars of North India. Front Nutr 7: 141. https://doi.org/10.3389/fnut.2020.00141
- 44. Tabbita F, Pearce S, Barneix A. 2017. Breeding for increased grain protein and micronutrient content in wheat: Ten years of the GPC-B1 gene. J Cereal Sci 73: 183-191.
- 45. Uauy C, Brevis JC, Dubcovsky J. 2006. The high grain protein content gene Gpc-B1 accelerates senescence and has pleiotropic effects on protein content in wheat. J Exp Bot 57: 2785-2794.
- 46. Waters BM, Uauy C, Dubcovsky J, Grusak MA. 2009. Wheat (Triticum aestivum) NAM proteins regulate the translocation of iron, zinc, and nitrogen compounds from vegetative tissues to grain. J Exp Bot 60: 4263-4274.
- 47. Wilkinson PA, Allen AM, Tyrrell S, Wingen LU, Bian X, Winfield MO, Burridge A, Shaw DS, Zaucha J, Griffiths S, Davey RP, Edwards KJ, Barker GLA. 2020. CerealsDB-new tools for the analysis of the wheat genome: Update 2020. Database 2020. baaa060.
- 48. Yang J, Park J, Son JH, Kim KH, Kim KM, Jeong H, Kang C, Son JY, Park T, Choi C. 2021. Protein and arabinoxylan contents of whole grains from wheat genentic resources cultivated in Korea. Korean J of Crop Sci 66: 29-36.
- 49. Yates AD, Allen J, Amode RM, Azov AG, Barba M, Becerra A, Bhai J, Campbell LI, Carbajo Martinez M, Chakiachvili M, Chougule K, Christensen M, Contreras-Moreira B, Cuzick A, Da Rin Fioretto L, Davis P, De Silva NH, Diamantakis S, Dyer S, Elser J, Filippi C, Gall A, Grigoriadis D, Guijarro-Clarke C, Gupta P, Hammond-Kosack KE, Howe KL, Jaiswal P, Moore V, Muffato M, Mushtaq A, Naamati G, Naithani S, Olson A, Parker A, Paulini M, Pedro H, Perry E, Preece J, Quinton-Tulloch M, Rodgers F, Rosello M, Ruffier M, Seager J, Flicek P. 2022. Ensembl genomes 2022: An expanding genome resource for non-vertebrates. Nucleic Acids Res 50(D1):D996-D1003.