Abstract
The lack of understanding of topics in uncharted research areas can often be mitigated through a careful review of the existing literature. However, when a field is not well-studied, relying on assumptions before starting a project should be avoided. This article highlights the dangers of such presumptions as demonstrated by the case of brown planthopper (Nilaparvata lugens) detection in rice field. Although unpiloted aerial vehicles (UAVs) have shown promise in various agricultural applications, their effectiveness in the early detection of brown planthopper damage was initially assumed based on the expectation of visible symptoms. The image analysis in the current study indicated that images obtained from a camera mounted on a UAV could not detect the symptoms of the very early stages of damage from brown planthoppers. An overlooked factor was whether the pest damage was uniformly distributed across an entire rice plant. If symptoms appear consistently, early detection using a top-down view from a UAV is possible; otherwise, detection may be delayed. Our findings emphasize the need for thorough preliminary research to avoid failure. By investigating the biological characteristics of the target pest and the potential limitations of detection methods, researchers can greatly improve their chances of success. We hope that readers will recognize the importance of thoroughly examining unexplored areas before embarking on new research.
-
Key words: pest, early detection, UAV, image analysis, field management
Introduction
The unmanned aerial vehicles (UAV) has been applied to agricultural area in various ways. In fact, UAVs are revolutionizing agriculture by providing farmers with valuable insights into their crops through image analysis. UAVs can detect early signs of plant diseases (
Kouadio et al. 2023), identify nutrient deficiencies (
Uktoro et al. 2024), and monitor soil moisture levels (
Ge et al. 2021), aiding in disease prevention (
Neupane et al. 2021) and efficient irrigation (
Wenting et al. 2020). Additionally, UAVs can estimate crop yield by counting plants and assessing crop health (
Hassan et al. 2022), while also identifying and mapping weeds for targeted control (
Hunter et al. 2020). By creating accurate field boundary maps and digital elevation models, UAVs help farmers understand their land and optimize agricultural practices (
Ajayi et al. 2017). This data enables precision agriculture, such as variable rate application of inputs and site-specific management, leading to improved crop yields and reduced resource waste.
These astonishing successes were the result of collaborations between multiple engineering techniques and various agricultural disciplines. Such collaborative studies work well when all parties communicate effectively. Furthermore, success is achieved when each domain understands its role and expertise. If any of the teams lack clarity in their tasks, the entire project may fail from the outset. Unfortunately, this type of failure tends to occur in emerging fields, such as UAV-related research, particularly among those who are just starting out. In the worst case, when policymakers or research planners are overconfident in their knowledge, it can lead to the development of impractical or unfeasible projects. Here, we demonstrated what happened when the early detection of brown planthopper (Nilaparvata lugens) damage using UAV was pursued in the rice field without knowledge in disease symptom pattern.
Material and Method
Study Area
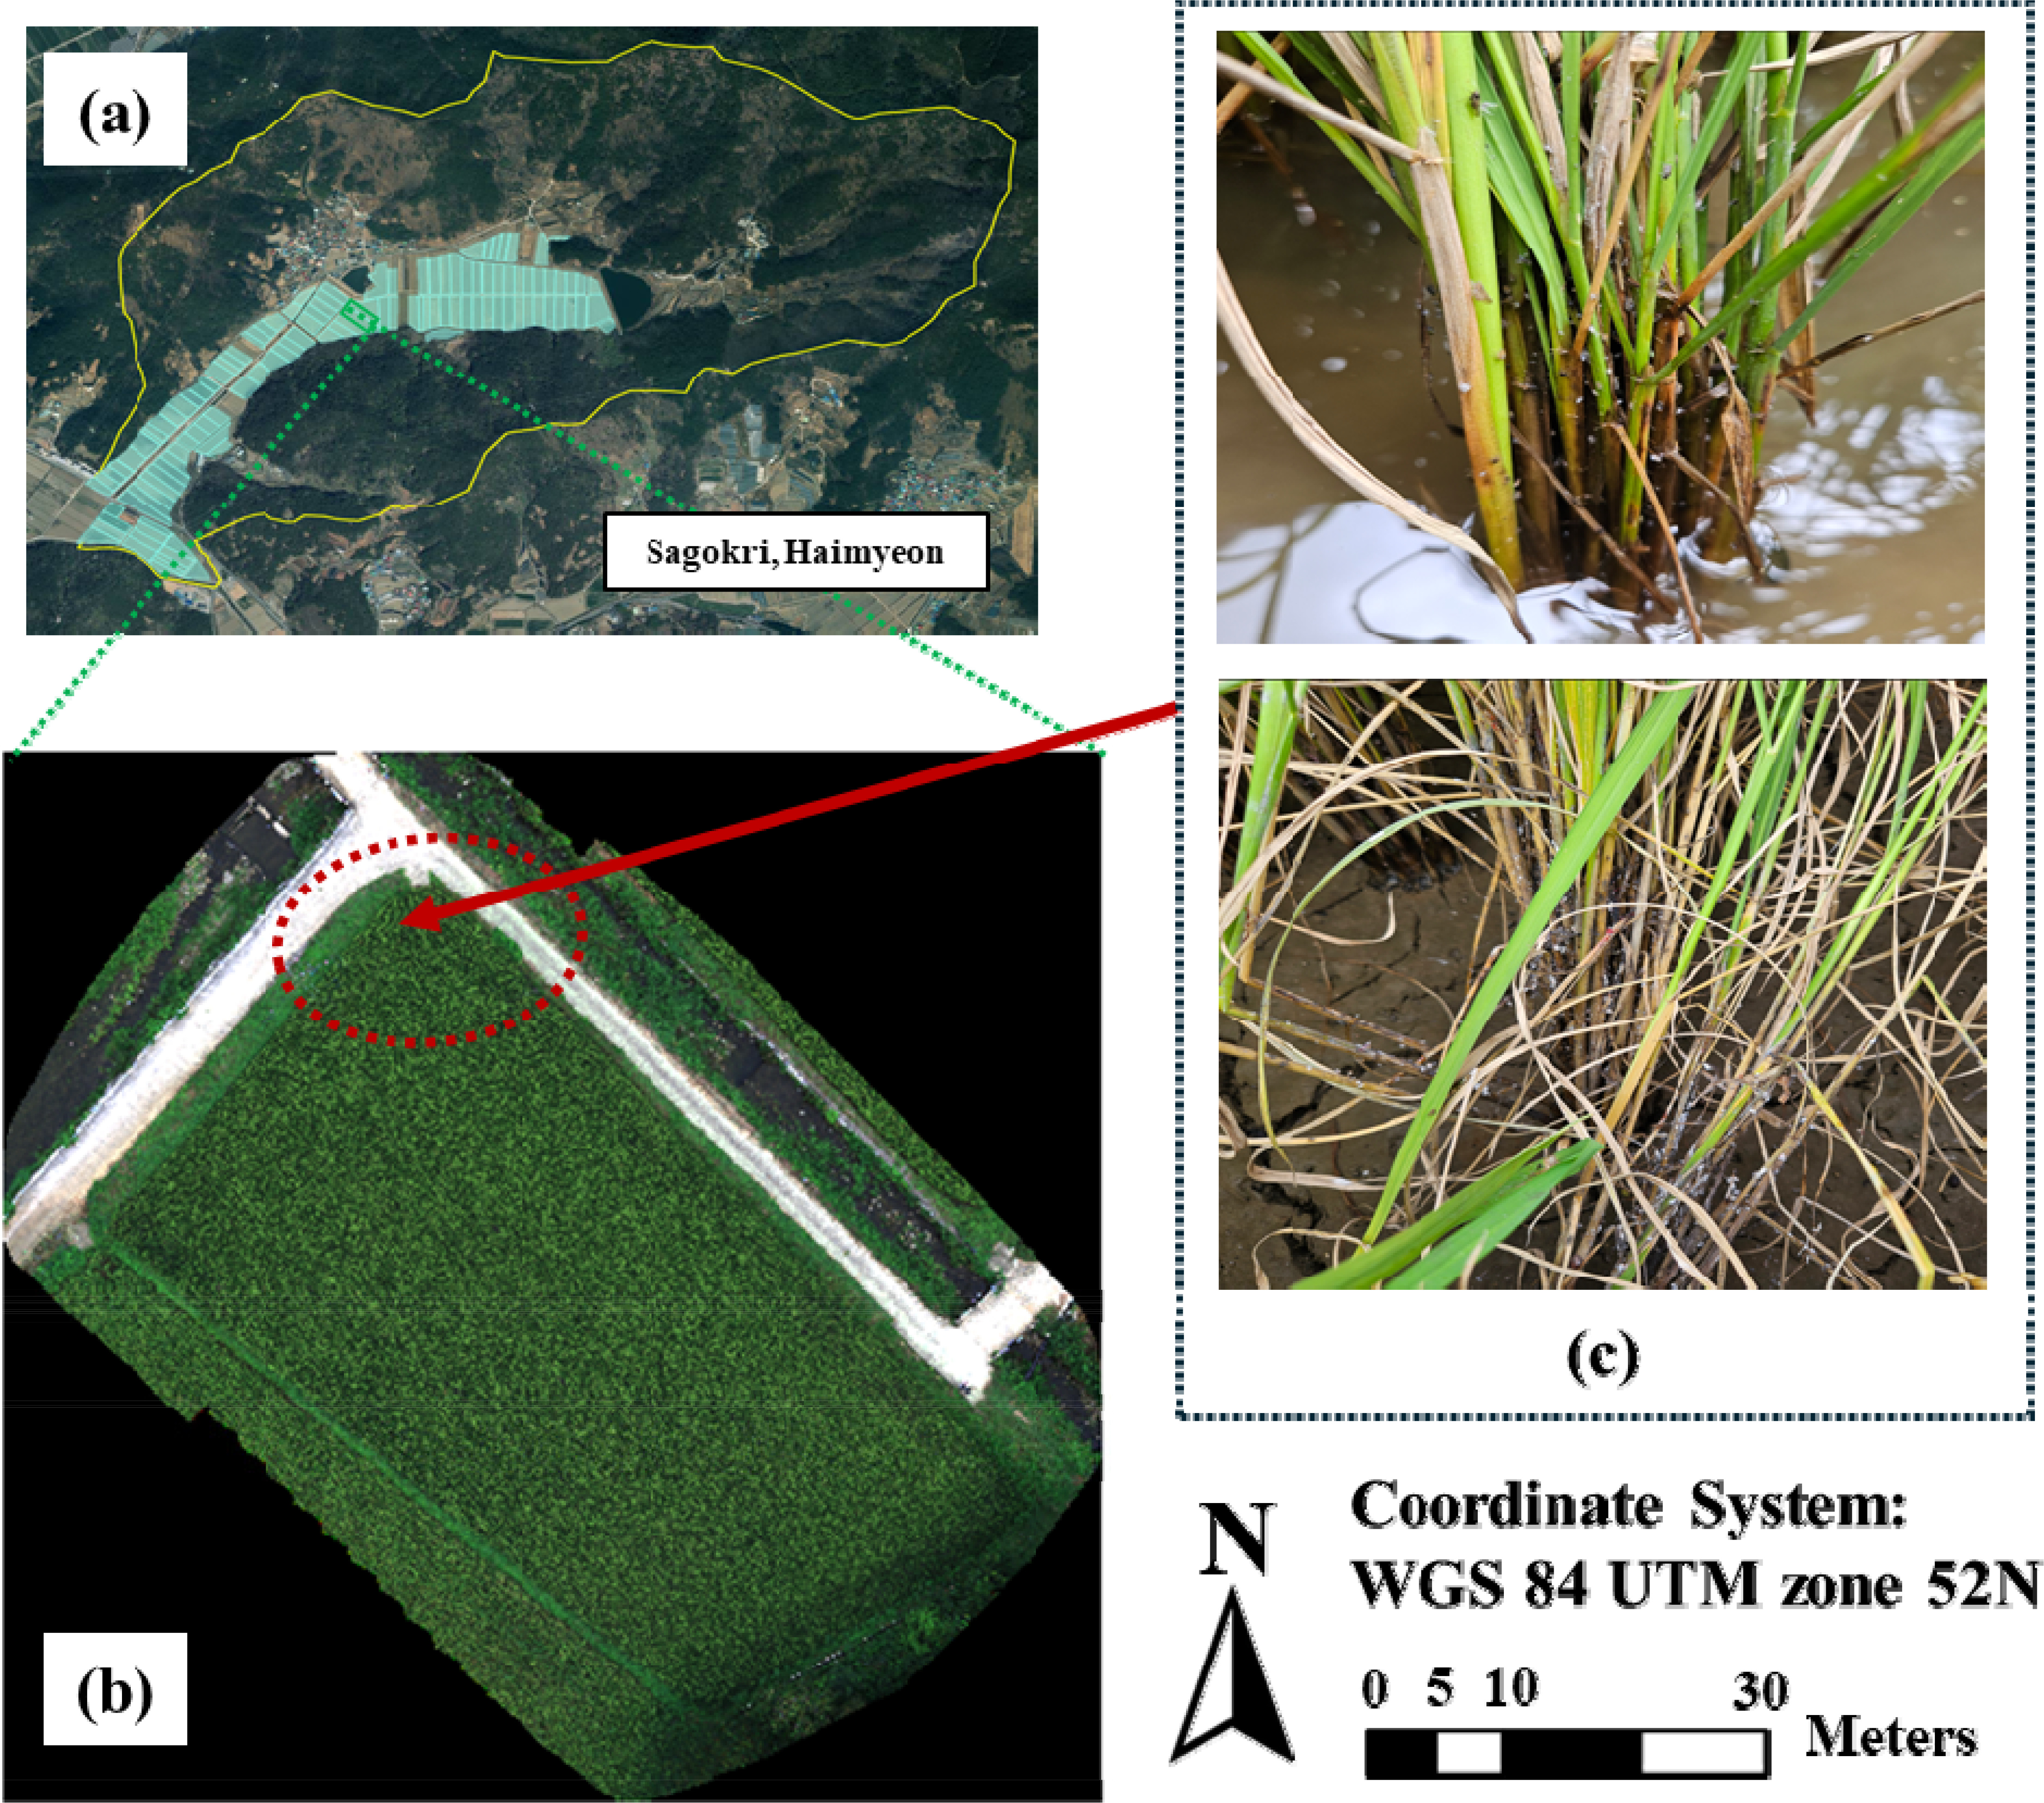
This study was carried out in a commercial rice field located in Sagokri, Haimyeon, Goseong-gun, Gyeongsangnam-do (
Fig. 1). The field covers an area of 3,248.5 m², with a slope varying between 7% and 15%, and has loam soil (Heuktoram,
https://soil.rda.go.kr). The experimental site experiences an average annual temperature of 12°C, a temperature range of 25°C, and an annual precipitation of 1,300 mm.
Beginning in mid-August 2024, five surveys were conducted to monitor brown planthopper emergence in Sagokri, a region where the pest was prevalent in 2023. Rice was cultivated across 126 fields in the area, with a significant increase in the brown planthopper population noted in the field marked in green on August 26 (
Fig. 1). In particular, the location marked in red in
Fig. 1 was identified as the critical site of brown planthopper emergence within this field. As a result, data collected by the UAV over the red-marked area was analyzed to detect any notable differences compared to other regions within the target fields.
UAV Flight and Photogrammetric Process
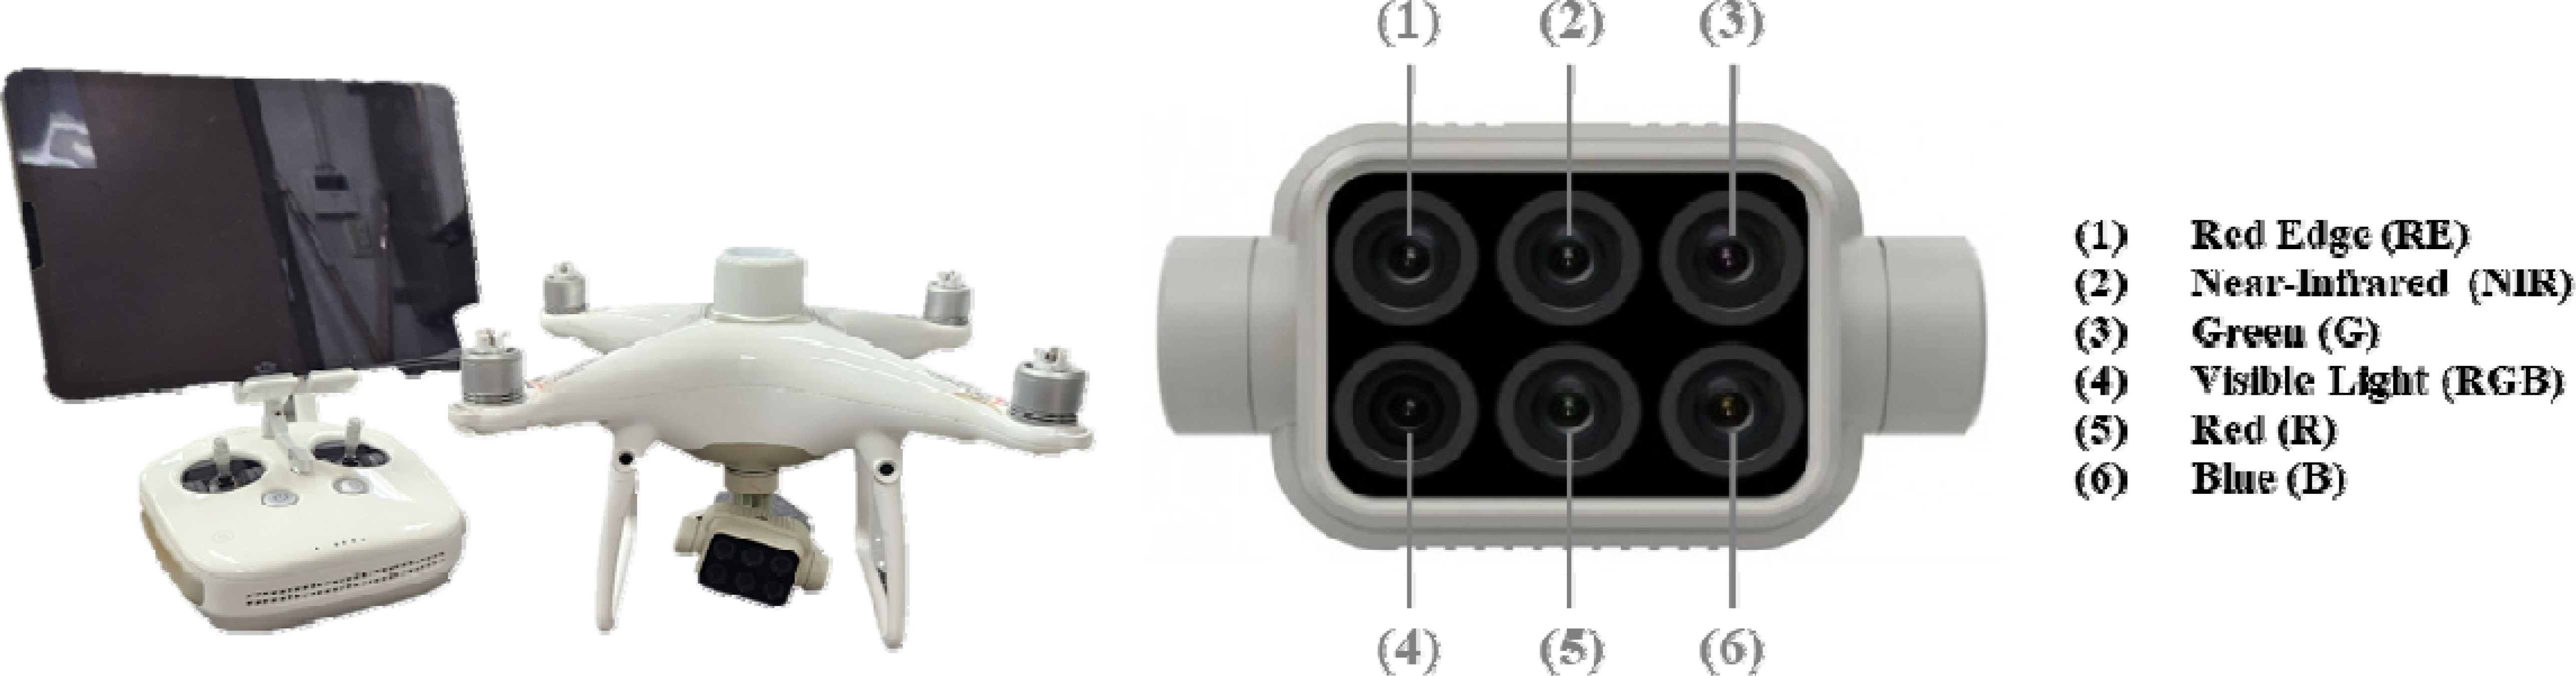
The DJI P4 multispectral UAV was used for the experiment in the rice field (
Fig. 2). This UAV has a take-off weight of 1,487 g and an average flight time of 30 minutes. It is equipped with an imaging system that includes six 1/2.9-inch CMOS sensors, allowing it to capture both RGB images through a visible camera and spectral data simultaneously through a multispectral imaging system covering five spectral bands. The ranges of these spectral bands are: Blue (B): 450 nm±16 nm; Green (G): 560 nm±16 nm; Red (R): 650 nm±16 nm; Red Edge (RE): 730 nm±16 nm; and Near-Infrared (NIR): 840 nm±26 nm.
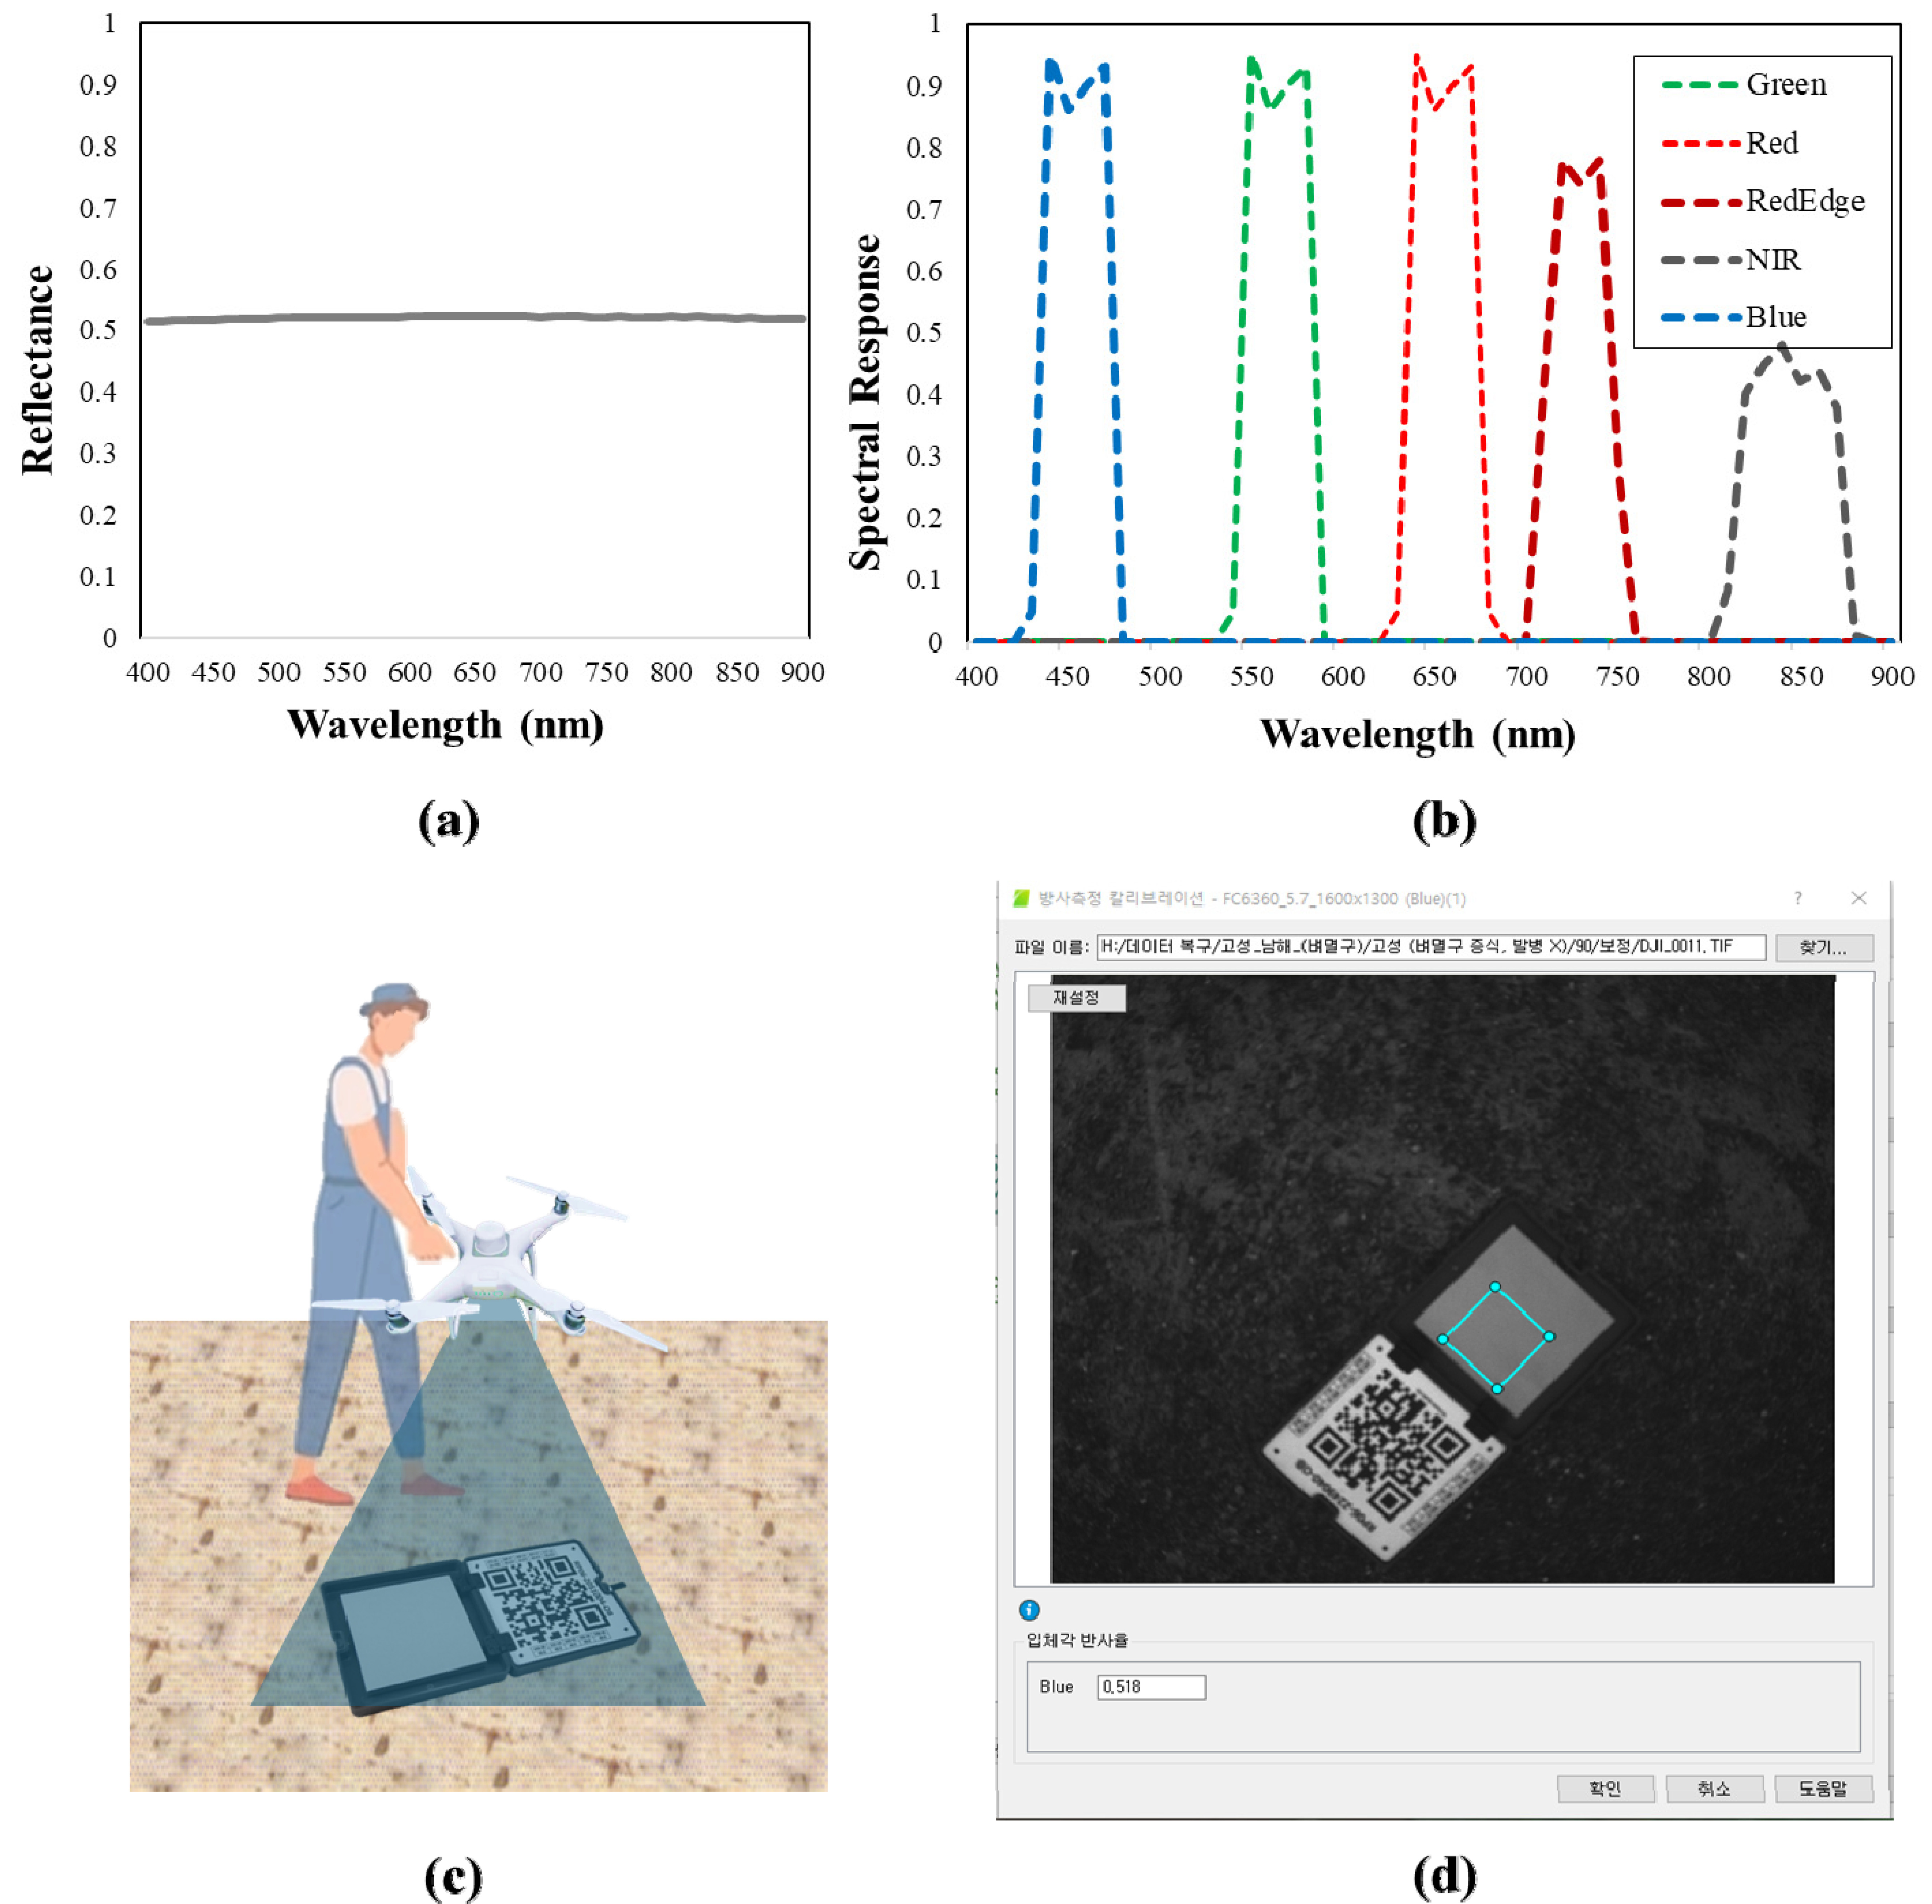
The UAV mission was conducted using the GS Pro app (DJI, China) at an altitude of 20 m, with 80% overlap and sidelap to ensure complete coverage of the target field. Waypoints were created for the mission, and location information was tagged at each waypoint using camera triggers. The DJI P4 multispectral system, equipped with real-time kinematic-global positioning system (RTK-GPS), detected positional information with an accuracy margin of less than 5 cm, enabling precise flight along the designated waypoints. The flights were carried out between 11:00 am and 12:00 pm on September 2, 2024. Immediately after the flight, a Calibrated Radiometric Panel (CRP, Micasense, USA) was captured to perform radiometric calibration, converting the sensor's digital numbers into reflectance values (
Fig. 3).
The spectral response data from the UAV's multispectral sensor, along with the reflectance data of the CRP provided by the manufacturer, were used to calculate the mean reflectance values for each band of the multispectral sensor, as described in Equation (2) (
Table 1). The overlapping images captured by the UAV were processed into reflectance maps for each spectral band using Pix4Dmapper Pro 3.0.17 (Pix4D SA, Lausanne, Switzerland). During processing, the “Radiometric Processing and Calibration” option was set to “Camera and Sun Irradiance” for correction. The CRP area was manually identified from the ground-captured CRP image immediately after the flight, and the average reflectance value for this area was recorded following
Table 1. This radiometric calibration accounted for changes in irradiance during the UAV flight and converted the multispectral digital numbers into accurate reflectance values (Wang 2021). The reflectance maps generated for each band were the n used to evaluate the potential for early detection of brown planthopper infestations.
Where is indicated the calculated mean reflectance values of the CRP, denotes the standard reflectance spectrum of the CRP provide by manufacturer, represents the spectral response of the image sensor, and k k corresponds to one of the bands: Blue (B), Green (G), Red (R), Red Edge (RE), or Near-Infrared (NIR).
Image Processing and Data Extraction
In this study, the normalized difference vegetation index (NDVI) was employed to detect brown planthopper infestations. Previous research has demonstrated that vegetation indices based on NIR band spectral data captured by UAVs often show lower values in crops affected by pests compared to healthy crops. For instance, Choosumrong et al. (2023) detected insect damage in banana trees using UAV-based vegetation indices, noting that affected trees had lower values in several NIR-based indices, including NDVI. Similarly,
Santos et al. (2022) analyzed coffee plant infections caused by the leaf miner pest (
Leucoptera coffeella) with UAV-acquired multispectral data, finding reduced NDVI values in infected coffee plants.
Narmilan et al. (2022) also used NDVI to detect white leaf disease in sugarcane. Building on these studies, this research aimed to test the hypothesis that NDVI values from UAV data could identify damage from brown planthoppers in rice. If this hypothesis is correct, the multispectral observations should indicate lower NDVI values in the red-marked areas of the target field, as illustrated in
Fig. 1.
The NDVI map for the target field was generated using the reflectance maps of the NIR and RED bands, following the calculation outlined in Equation (1). Despite effective weed management resulting in a weed-free field, the NDVI map still included shadows and bare soil that required further removal. To address this, an Excess Green image (ExG) was used to differentiate crops from soil and shadows, based on the threshold value of 0.045
as described by Li et al. (2018) in Equation (3). This ExG-based filtering method was applied in this study (
Fig. 4). Crop regions identified by the ExG filter were assigned a value of 1, while soil and shadow regions were marked as ‘NAN.’ The NDVI image was then multiplied by this filtered image to exclude non-crop areas, resulting in an NDVI map that highlighted only the crop regions, as shown in
Fig. 4 (d). For data extraction, random points were generated at 0.6 m intervals across the target field, totaling 10,000 points. Covering an area of approximately 3,000 square meters, this point density ensured an average spacing of about 6 meters between points. A buffer of 0.3 m was applied around each random point to define the Region of Interest (RoI) for data extraction.
The equations of NDVI and ExG are like followings:
Where RED and NIR represent the reflectance of red and near-infrared bands, respectively.
Where GREEN, BLUE and RED the reflectance of green, blue and red bands, respectively.
The steps for calculating the vegetation index and generating the RoI were carried out using QGIS software. Shadow and soil removal were managed with Python's OpenCV and rasterio modules. The filtered NDVI map was then used to assess whether regions with relatively low NDVI values aligned with the affected areas.
Result
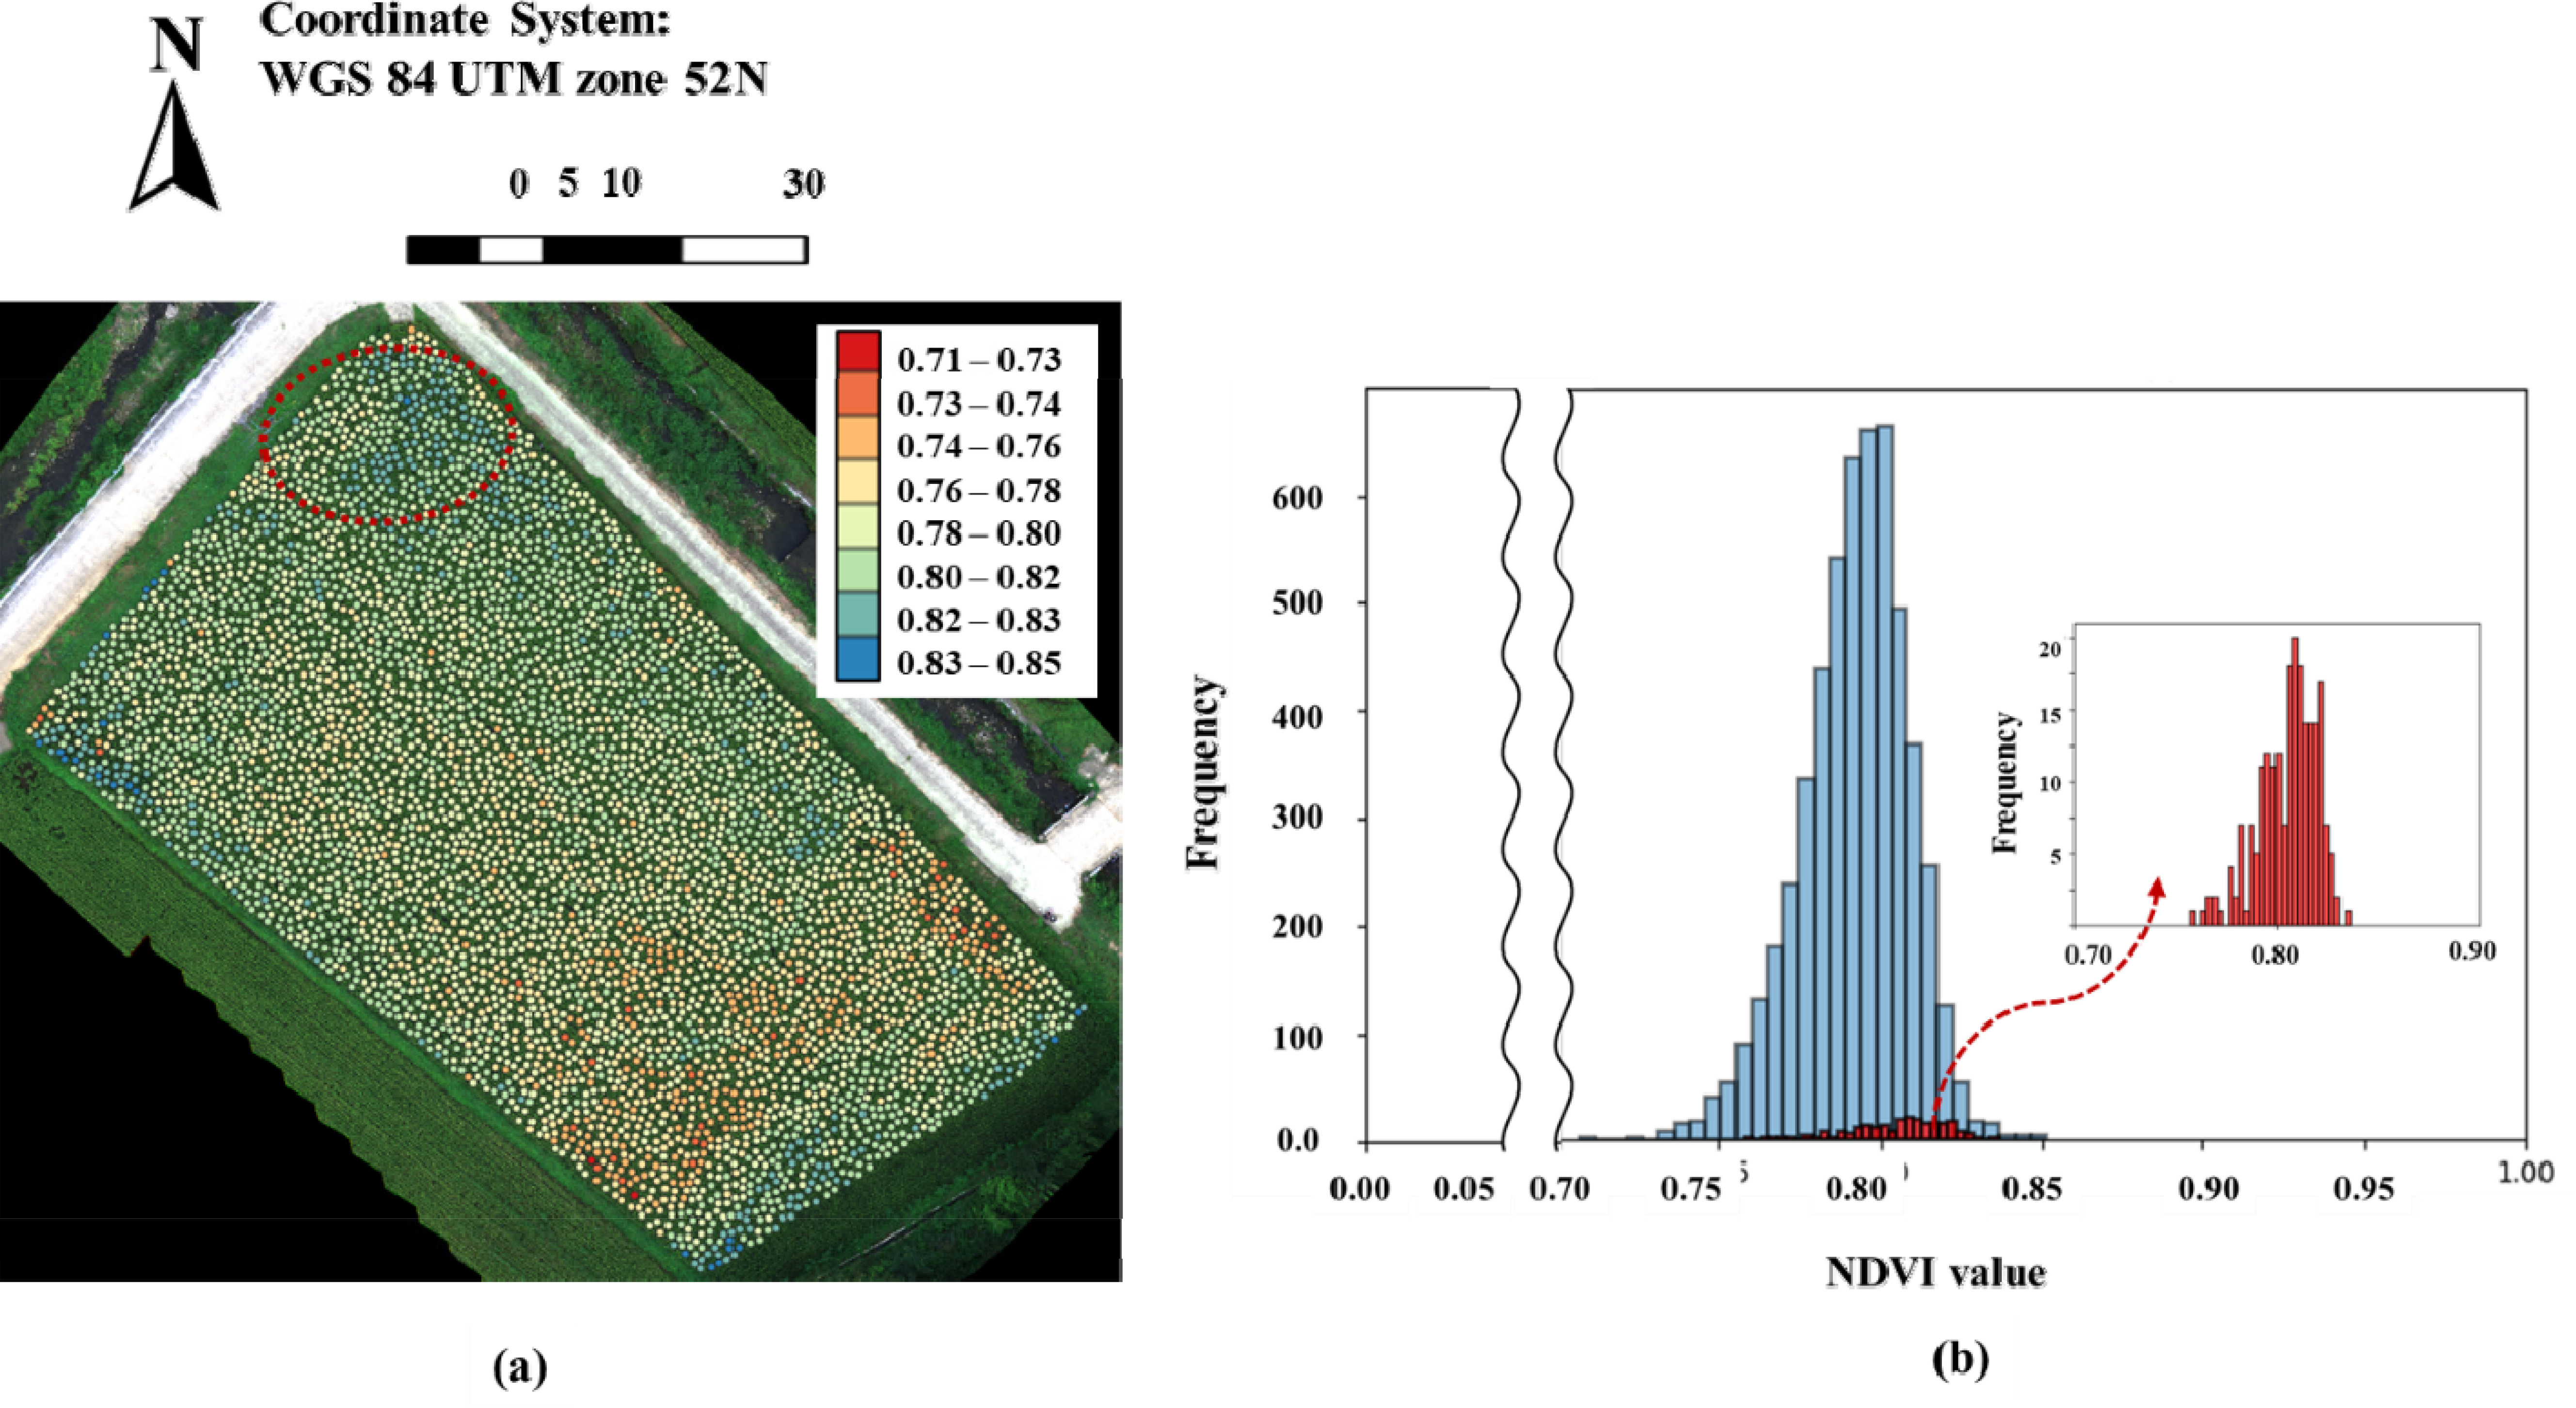
The data extracted from the modified NDVI map were categorized into eight classes to create a choropleth map, with the results of brown planthopper detection based on previous studies shown in
Fig. 5. Contrary to expectations, brown planthopper proliferation was detected in the northern region (
Fig. 5a); however, the NDVI values in this area did not appear significantly lower compared to other regions (
Fig. 5b). The histogram of NDVI values in
Fig. 5 shows that the affected area had values closer to the mean rather than at the lower end of the histogram. Additionally, the southern region exhibited relatively lower NDVI values. As a result, the initial presumption appears to be rejected.
Discussion
Previous studies have demonstrated the effectiveness of UAVs in detecting pest damage in fields, primarily focusing on leaf-based indicators (
Duarte et al. 2022,
Hentz et al. 2018,
Hunt et al. 2017,
Tao et al. 2022,
Tetila et al. 2020). While those researches have effectively utilized UAVs for detecting pest damage based on leaf characteristics, our current study highlights a potential limitation. Despite capturing leaf images from a top-down perspective, similar to prior work, we were unable to identify disease symptoms using UAV-mounted cameras. This suggests that the visual differences between healthy and infected leaves may be subtle or obscured from this vantage point. Observing the symptom progression depicted in
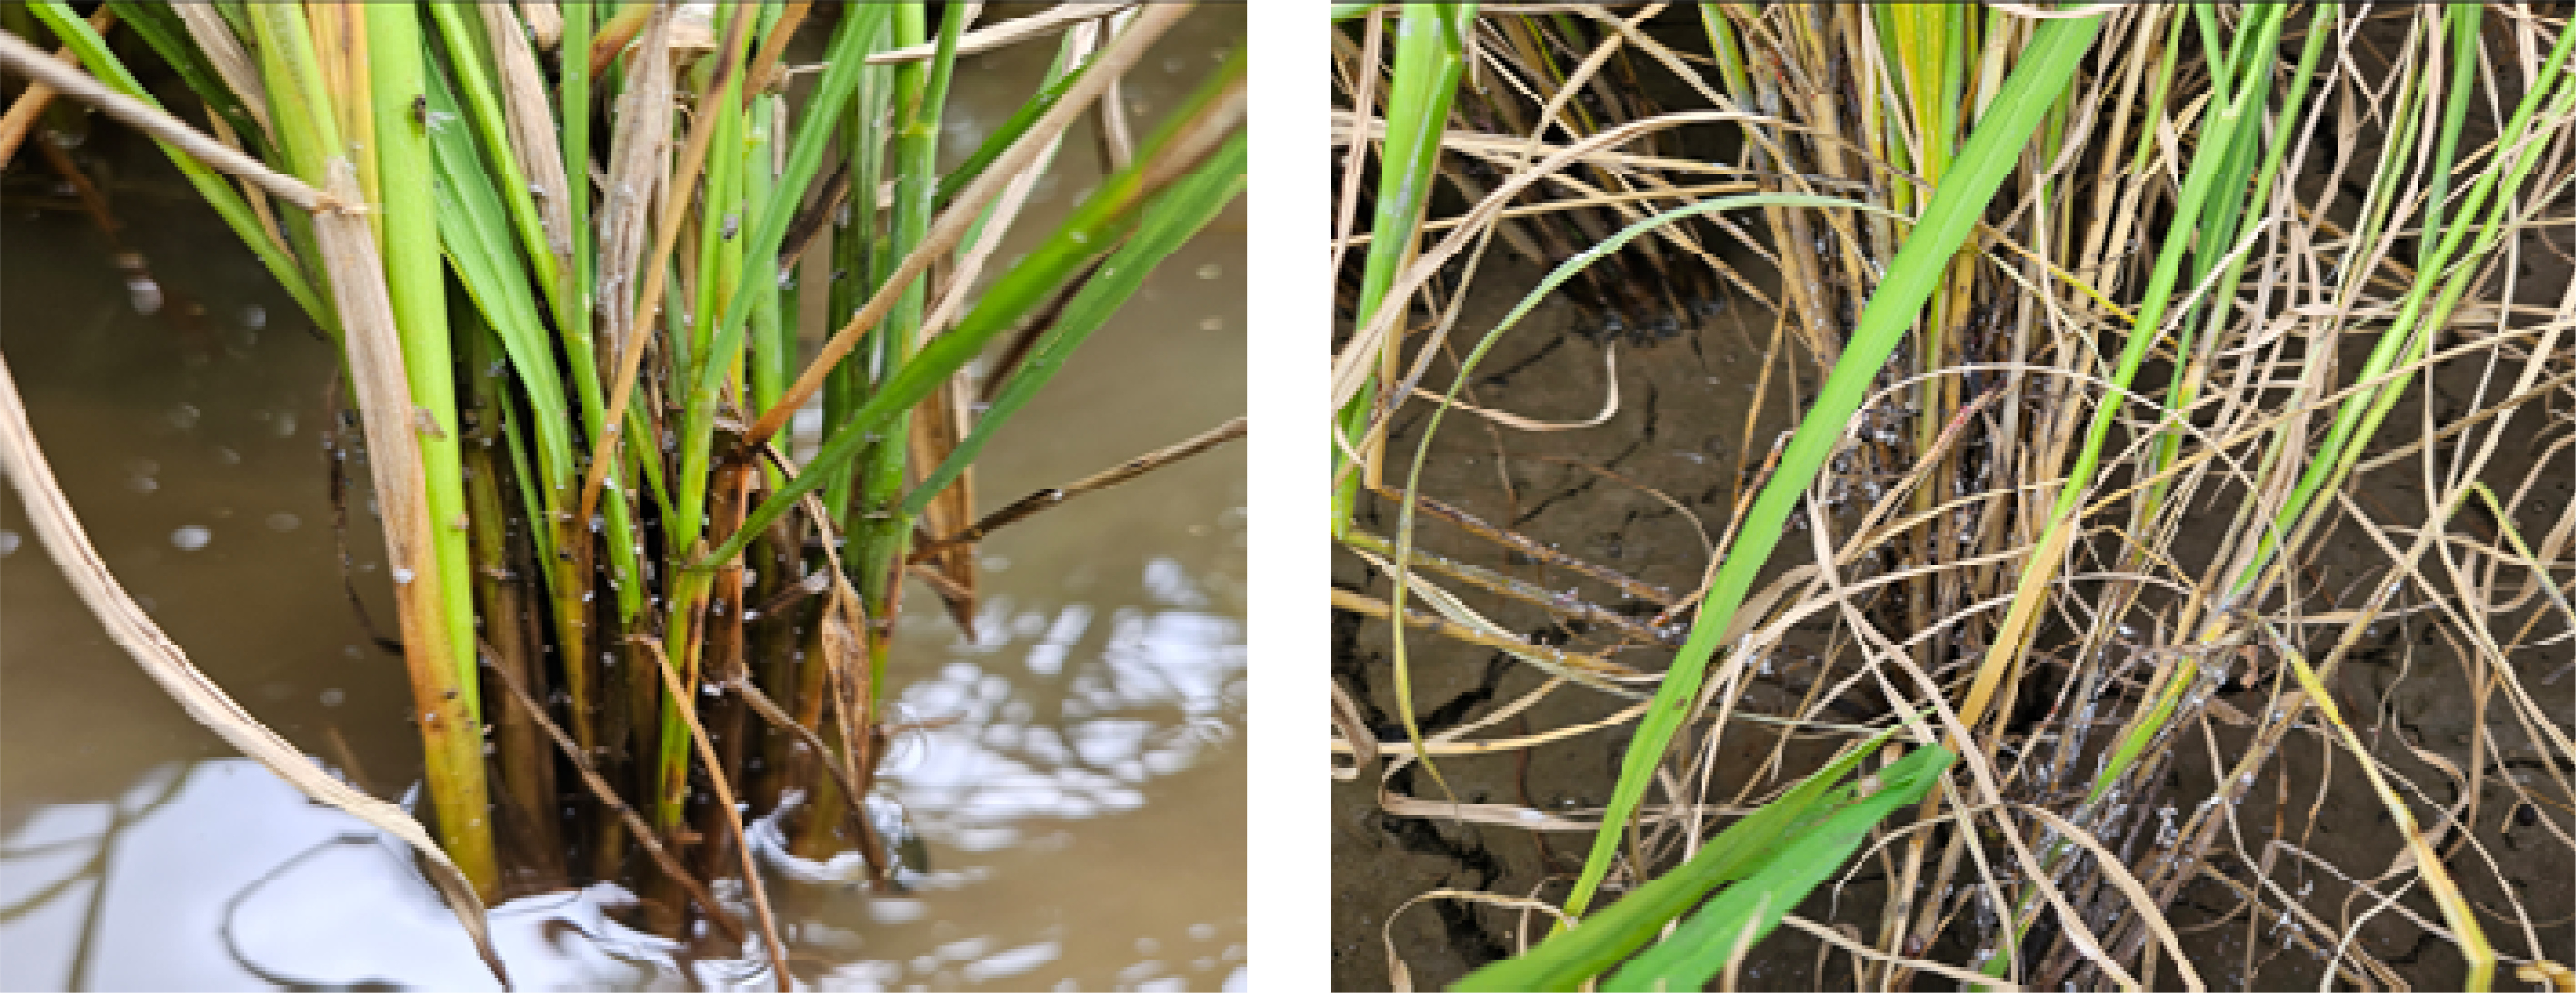
Fig. 6, we noticed a temporal discrepancy between stem and leaf discoloration. This indicates that the disease may manifest differently in different plant parts, potentially hindering early detection using UAVs if symptoms on stems are more indicative of infection. Further investigation is required to confirm this hypothesis and explore alternative detection strategies.
The challenges encountered in our study emphasize the critical role of biological knowledge in experimental design. A solid understanding of the target traits is fundamental for selecting appropriate detection methods and ensuring the validity of research findings. Neglecting this crucial step can undermine the entire project. To avoid such pitfalls, project planners, investigators, and scientists must meticulously examine their objectives and validate the feasibility of their targets before proceeding with experiments.
Acknowledgments
This research was carried out with the support of “Cooperative Research Program for Agriculture Science & Technology Development (Development of an approach to analyze timing and locality of migratory pests occurrence for rice using information derived from an automated surveillance system: RS-2021-RD009729)” Rural Development Administration, Republic of Korea. Also, this work was supported by the BK21 FOUR, Global Smart Farm Educational Research Center, Seoul National University, Seoul, Korea and Advanced Institute of Convergence Technology, Suwon, 16229, Republic of Korea.
Fig. 1The experimental sites in Sagokri, Haimyeon, where damage caused by brown hopper (Nilaparvata lugens) occurred last year. The rice fields are distributed across 126 plots, as shown in the sky-colored region (a). The field under investigation is highlighted as red mark (b).

Fig. 2The unmanned aerial vehicle (UAV) used in this stud. This is equipped with a multispectral sensor composed of five spectral bands and one RGB camera, enabling simultaneous image acquisition across both systems.

Fig. 3The standard reflectance spectrum of the Calibrated Radiometric Panel (CRP) by manufacturer (a), spectral response of the blue, green, red, red-edge and near-infrared bands (b), diagram of capturing the CRP with the multispectral sensor on UAV. It is crucial to ensure that no shadows are cast on the CRPl during the capture (c). The example of radiometric calibration process, “Radiometric Processing and Calibration” in Pix4Dmapper (d).

Fig. 4RGB field image including soil and shadows (a), NDVI field image including soil and shadows (b), crop region image extracted using ExG-based filtering method (
Li et al. 2018) (c), NDVI image of the crop region after removing soil and shadows (d).
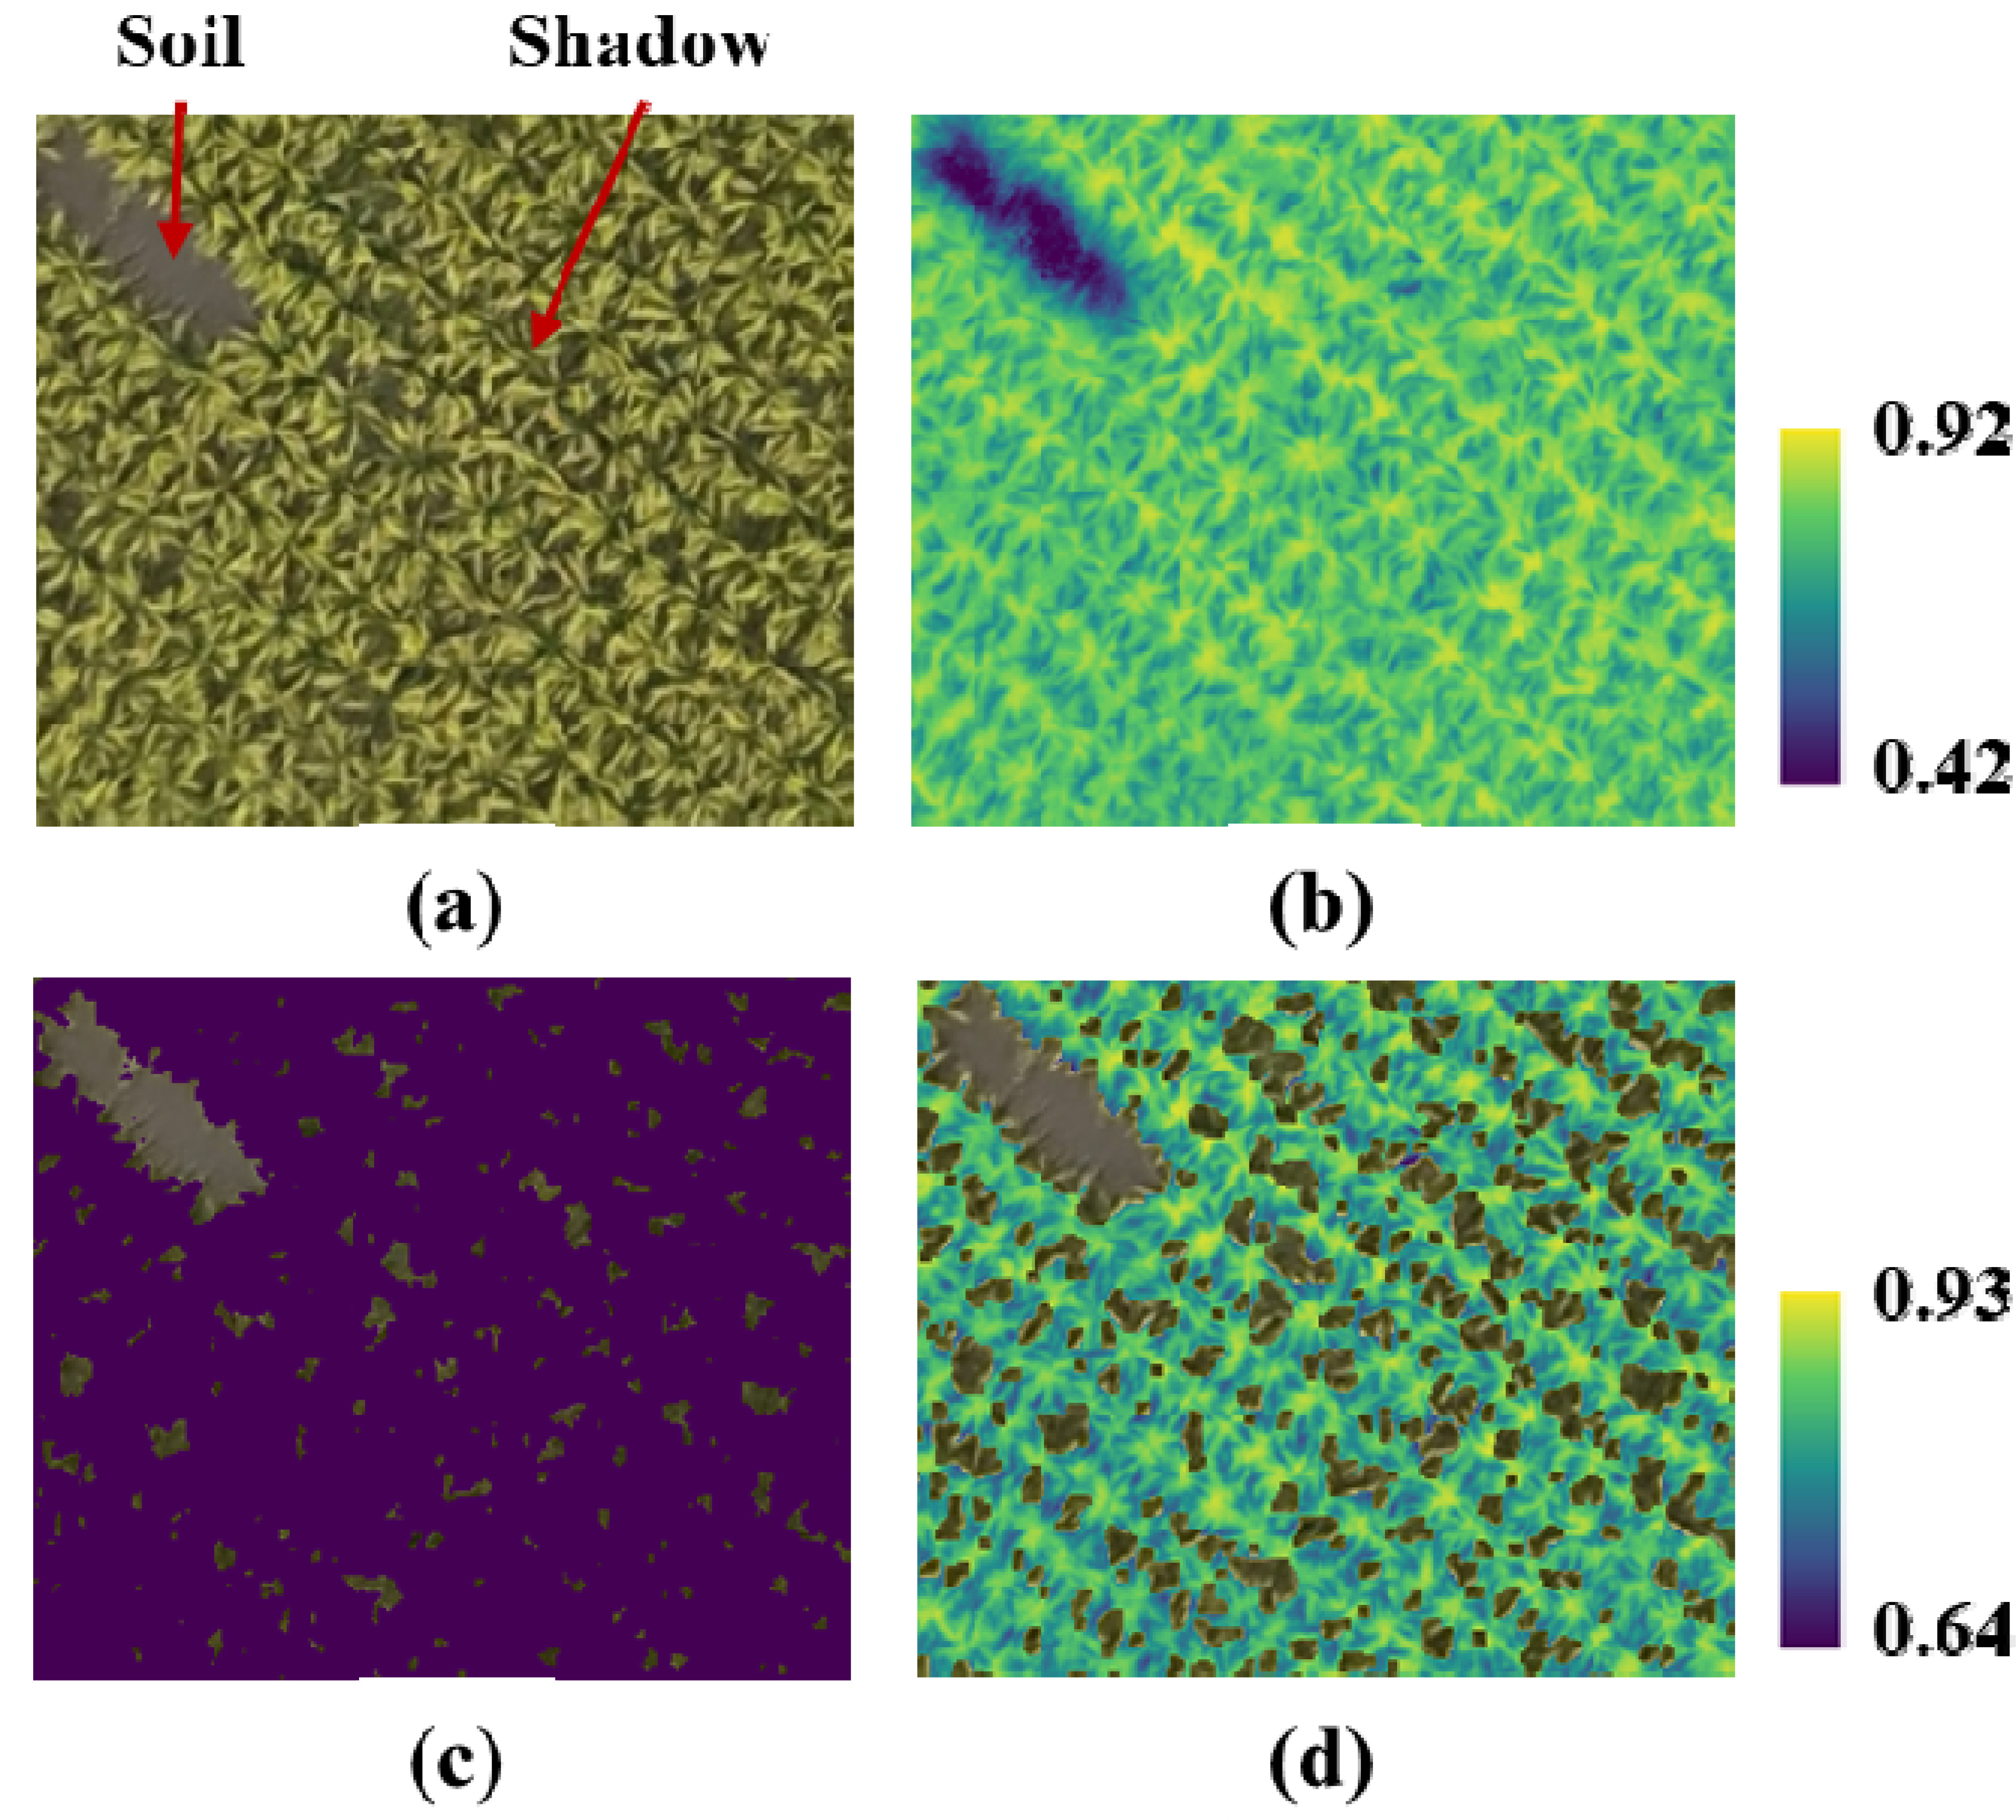
Fig. 5NDVI choropleth map of the observed field (a), NDVI value distribution for the entire field (blue) and NDVI distribution for the brown planthopper affected area (red) (b).

Fig. 6The damage pattern caused by the brown planthopper (Nilaparvata lugens) in rice plants.

Table 1Spectral band information of the UAV used in this study.
Table 1
|
Image Band |
Frequency (Percentage) |
|
Blue (450 nm 16nm) |
0.518 |
|
Green (560 nm 16nm) |
0.522 |
|
Red (650 nm 16nm) |
0.523 |
|
Red Edge (730 nm 16nm) |
0.523 |
|
Near-Infrared (840 nm 26nm) |
0.521 |
References
- 1. Ajayi OG, Salubi AA, Angbas AF, Odigure MG. 2017. Generation of accurate digital elevation models from UAV acquired low percentage overlapping images. Int J Remote Sens 38: 3113-3134.
- 2. Choosumrong S, Hataitara R, Sujipuli K, Weerawatanakorn M, Preechaharn A, Premjet D, Laywisadkul S, Raghavan V, Panumonwatee G. 2023. Bananas diseases and insect infestations monitoring using multi-spectral camera RTK UAV images. Spat Inf Res 31: 371-380.
- 3. Duarte A, Borralho N, Cabral P, Caetano M. 2022. Recent advances in forest insect pests and diseases monitoring using UAV-based data: A systematic review. Forests 13: 911
- 4. Ge X, Ding J, Jin X, Wang J, Chen X, Li X, Liu J, Xie B. 2021. Estimating agricultural soil moisture content through UAV-based hyperspectral images in the arid region. Remote Sens 13: 1562
- 5. Hassan SI, Alam MM, Zia MY, Rashid M, Illahi U, Su'ud MM. 2022. Rice crop counting using aerial imagery and GIS for the assessment of soil health to increase crop yield. Sensors 22: 8567
- 6. Hentz ÂM, Strager MP. 2018. Cicada (Magicicada) tree damage detection based on UAV spectral and 3D data. Nat Sci 10: 31-44.
- 7. Hunt ER Jr, Rondon SI. 2017. Detection of potato beetle damage using remote sensing from small unmanned aircraft systems. J Appl Remote Sens 11: 026013.
- 8. Hunter III JE, Gannon TW, Richardson RJ, Yelverton FH, Leon RG. 2020. Integration of remote-weed mapping and an autonomous spraying unmanned aerial vehicle for site-specific weed management. Pest Manag Sci 76: 1386-1392.
- 9. Kouadio L, El Jarroudi M, Belabess Z, Laasli SE, Roni MZ, Amine ID, Mokhtari N, Mokrini F, Junk J, Lahlali R. 2023. A review on UAV-based applications for plant disease detection and monitoring. Remote Sens 15: 4273
- 10. Li J, Shi Y, Veeranampalayam-Sivakumar AN, Schachtman DP. 2018. Elucidating sorghum biomass, nitrogen and chlorophyll contents with spectral and morphological traits derived from unmanned aircraft system. Front Plant Sci 9: 1406
- 11. Narmilan A, Gonzalez F, Salgadoe ASA, Powell K. 2022. Detection of white leaf disease in sugarcane using machine learning techniques over UAV multispectral images. Drones 6: 230
- 12. Neupane K, Baysal-Gurel F. 2021. Automatic identification and monitoring of plant diseases using unmanned aerial vehicles: A review. Remote Sens 13: 3841
- 13. Santos LMD, Ferraz GAES, Marin DB, Carvalho MADF, Dias JEL, Alecrim ADO, Silva MDLOE. 2022. Vegetation indices applied to suborbital multispectral images of healthy coffee and coffee infested with coffee leaf miner. Agri Engineering 4: 311-319.
- 14. Tao W, Wang X, Xue JH, Su W, Zhang M, Yin D, Zhu D, Xie Z, Zhang Y. 2022. Monitoring the damage of armyworm as a pest in summer corn by unmanned aerial vehicle imaging. Pest Manag Sci 78: 2265-2276.
- 15. Tetila EC, Machado BB, Astolfi G, de Souza Belete NA, Amorim WP, Roel AR, Pistori H. 2020. Detection and classification of soybean pests using deep learning with UAV images. Comput Electron Agric 179: 105836.
- 16. Uktoro AI, Renjani RA, Kusuma S, Asmono D, Wandri R, Alam S, Kramajaya MN, Riyanto AC, Suparyanto T, Pardamean B. 2024. Detecting nutrient deficiency in oil palm seedlings using multispectral UAV images. Commun Math Biol Neurosci 2024: 56.
- 17. Wang C. 2021. At-sensor radiometric correction of a multispectral camera (RedEdge) for sUAS vegetation mapping. Sensors 21: 8224
- 18. Wenting HA, Liyuan ZH, Yaxiao NI, Xiang SH. 2020. Review on UAV remote sensing application in precision irrigation. Trans Chin Soc Agric Mach 51: 1-14.